
Get updates on
new Options articles geared
at improving your trading consistency by providing your email address below!
by registering you agree to our
Privacy Policy
Three Key Technical Indicators all Traders Should Use
Oftentimes, technical analysis is written off as worthless.
However, as it has been proven time and time again, it should never be ignored because it gives us a very clear, defined picture of fear and greed. Or, the very psychology that drives stocks.
How to Spot Overbought Pivots up to 80% of the Time
With the incredibly popular Avengers: Endgame film, shares of Disney Co. exploded from a low of $107.50 to $142.50 in April 2019.
After the film grossed $1.2 billion in its opening weekend (biggest in history), analysts were still seen raising price targets. JP Morgan noted the stock could run to $150 a share by the end of the year.
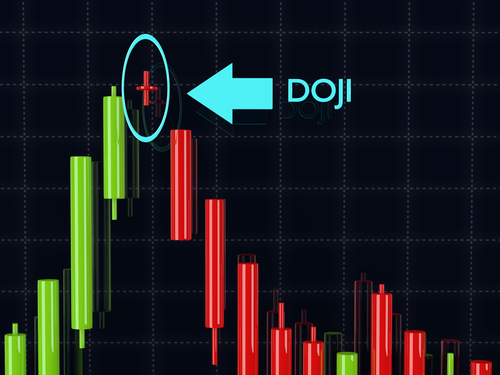
Three of the Most Powerful Candlesticks to Use
When Munehia Homma first created candlestick charts in the 1700s, he had no idea it’d change the way we look at stocks 300 years later.
To him, candlestick charting was meant for the rice trade.
Now, when applied to technical analysis, it can help give us a clear picture of trader emotion.
How to Use Full Stochastics in Your Trading
Fear can destroy a stock in seconds.
But it can also lead to quite a bit of opportunity.
Look at Coca-Cola (KO), for example in late February 2019.
Bollinger Band and Keltner Channel Trading: Similarities and Differences
Imagine jumping off a bridge with a bungee cord.
As you begin to reach the end of the cord’s pull, you’re quickly yanked in the other direction.
That very same thing happens with stocks when they become far too extended in overbought or oversold territory. And we judge exactly where that’s likely to happen with two key indicators.
How to Use the Chande Trend Meter (CTM) with 80% Success
Unbelievably, technical analysis is still written off as useless.
In fact, some denounce it as a laughable study of charts, patterns, and squiggly lines without any concrete or profitable results. Others argue it’s only good for short-term trading.
However, none of that is true.


