

Get updates on
new Options articles geared
at improving your trading consistency by providing your email address below!
by registering you agree to our
Privacy Policy

The Benefits of Combining Fundamental and Technical Analysis
Over the last 22 years, I’ve heard countless arguments for and against fundamental and technical analysis. While neither is perfect, they both have strengths we can capitalize on.

Three of the Most Consistent Candlestick Patterns to Understand
Candlestick patterns may have some odd names.
Abandoned baby bottom, three black crows, dark cloud cover, for example. But these are some of the most powerful tools you can add to your strategy, including these three.

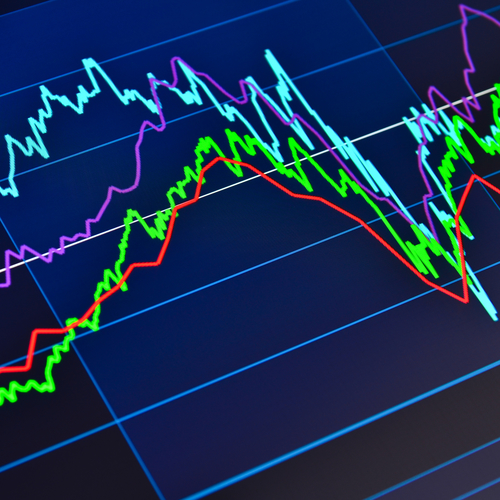
Top Technical Indicators for Any Trading Plan
Every time you trade a stock, it’s essential that you understand the psychology of the buyers and seller. If not, you begin to run the risk of losing money.
That’s the last thing any of us want to do.

Two of the Best “End of Year” Opportunities
It’s time to think about year-end strategies.
And while some are ridiculous and unworthy of attention, we have three favorites, including the “New Year’s Resolution,” and “the Dogs of the Dow.”
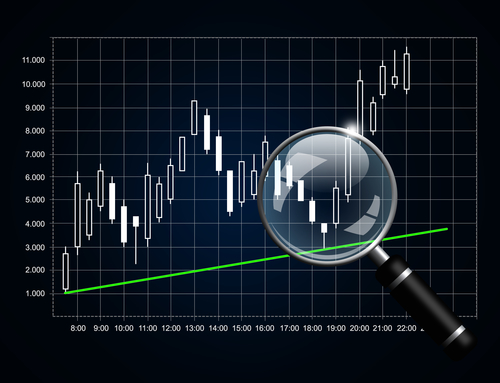
The Importance of Spotting Support and Resistance
The idea that drawing lines on a chart can make you money has been a matter of contention for years. But the fact remains that those lines are quite helpful.
You see, the key to the lines’ effectiveness lies entirely in its popularity among large audiences of traders. We’re talking about thousands, if not millions of traders looking for these very opportunities based on nothing more than support and resistance.
What Every Smart Investor Should Know about Market Pullbacks
Early October 2018 was quite painful for the average investor.
The major indices fell out of the sky. The tech-heavy NASDAQ fell from 8,100 to 7,300. The S&P 500 dropped from 2,925 to 2,725.