What Every Smart Investor Should Know about Market Pullbacks

Early October 2018 was quite painful for the average investor.
The major indices fell out of the sky. The tech-heavy NASDAQ fell from 8,100 to 7,300. The S&P 500 dropped from 2,925 to 2,725.
And, after hitting an all-time high of 26,951, the Dow Jones Industrials plummeted 1,400 points.
Of course, it’s tough to sugarcoat such a pullback.
But we have to remember a few things. Markets don’t run up in straight lines. We were long overdue for a healthy pullback at the time. It’s perfectly normal to see pullbacks in bull markets.
In the dot-com boom we saw more than five declines of more than 10% during the run.
Two, investors got a bit over-excited and nervous about bond yields in October 2018.
The benchmark 10-year Treasury yield spiked to a 3.25% -- its highest level since 2011.
When rates get this high, it raises the likelihood of tighter monetary policy, which can eventually trickle down to cap company profits and dividends. Higher rates hurt stocks by making bonds more attractive than stocks.
In addition, it can also make it expensive for companies to borrow and invest.
That’s what spooked the market in the worst month of the year.
So, what should an investor do about the stock market drop?
The best thing to do is sit tight and do nothing.
One, markets are resilient.
The last time the markets fell like this was January 2018. Markets plummeted nearly 1,200 points. Soon after, the market recovered and hit new highs.
Two, always use pullbacks as opportunity to trade resiliency.
As Warren Buffett would advise, “Be fearful when others are greedy and greedy when others are fearful.” Or, as Sir John Templeton would advise, “Buy at the point of maximum pessimism.” Or even as Baron Rothschild would tell you, “Buy the blood in the streets, even if the blood is your own.”
That’s because fear often breeds opportunity.
Three, remember the economy is still strong. Unemployment is at a historic low. Consumers and businesses are confident. GDP is above 4.2%. Even company earnings are expected to show continued progress.
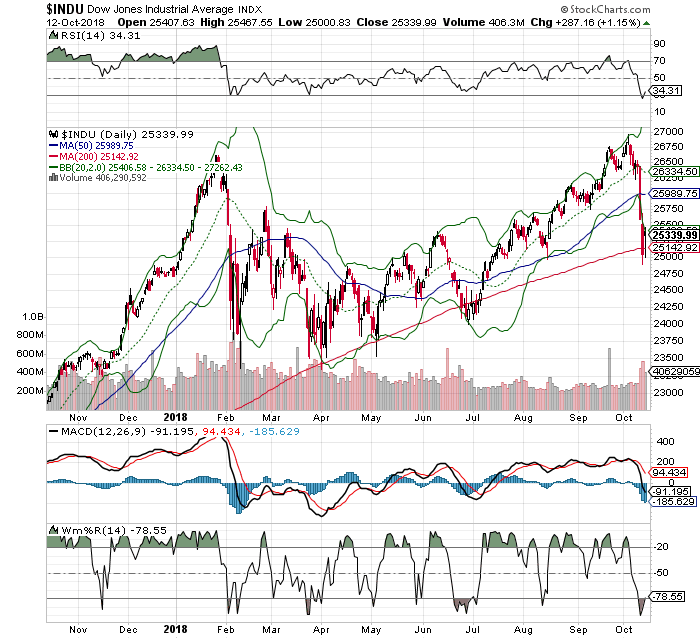
Four, pay attention to the technical pivot points.
They called the top and bottom in October 2018. Let’s start with the top. One, the DJIA was at its upper Bollinger Band (2,20). Relative strength (RSI) was overbought at its 70-line. Williams’ %R (W%R) was above its 20-line.
Surprise, surprise, the market pulled back, as it typically does when these align.
Now, take a look at the bottom of trend. Again, notice the DJIA is now outside its lower Bollinger Band (2,20), which is unsustainable. Two, RSI was now below its 30-line, and oversold. The last time it was this low, the DJIA bounced, too. Williams’ %R was below its 80-line. Once all confirmed an overbought situation, the DJIA bounced.
Sure, anyone can say these things after the fact. However, if you look for them prior to a market or stock move, you’d be surprised at how accurate they are.
In short, don’t’ allow market pullbacks to scare you away from the markets. Instead, sit tight and remember just how resilient markets have historically been.


