Using the Parabolic SAR to Identify Entries and Exits

The Parabolic Stop and Reverse (SAR), commonly known as Parabolic SAR is a trend following indicator that highlights current price direction.
It also provides entry and exit signals as well with dotted lines.
What we simply want to do is buy an asset when the dots move below the price, and sell or short-sell when the dots are above the asset price. The main advantage of the indicator is that during a strong trend the indicator will highlight that strong trend. During a downtrend, the indicator can highlight where that may begin.
Then again, you never want to rely on just one indicator. Be sure to verify your findings with other ones, including Bollinger Bands (2,20), MACD, RSI and Williams’ %R.
We can see the Parabolic SAR in action with Weight Watchers (WTW).
On a one-year chart of WTW, we can clearly see the dotted lines. When they are above the price of WTW, the stock has a tendency to move lower. Then, when they’re below the price of WTW, the stock begins to pivot higher.
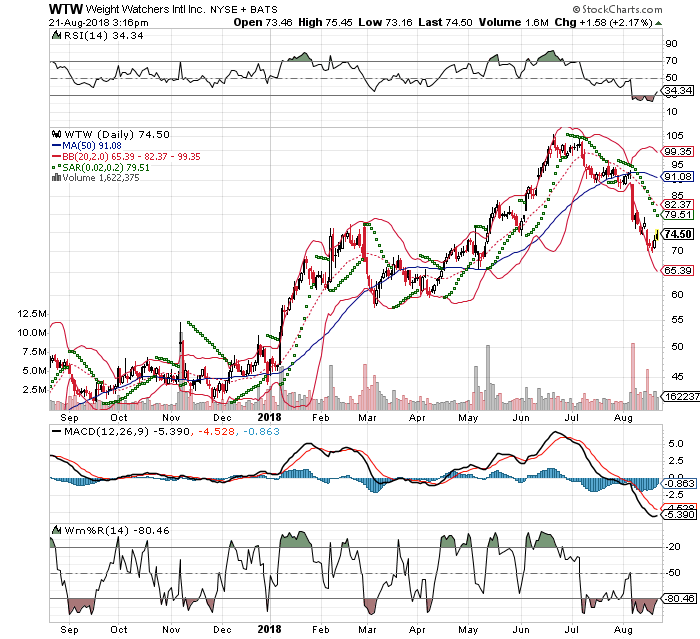
Interesting to note, the Parabolic SAR typically appears at the upper Bollinger Band (2,20), as RSI, MACD and Williams’ %R range begin to pivot in the opposite direction. Nearly 80% of the time, when all of these indicators align, the stock pivots in the other direction.
We can see this in the Dow Jones Industrial Average, too.
In fact, using the Dow Jones, we can see SAR is not a perfect indicator. In August 2018, even with SAR above the price of the Dow, the index continued to push higher.
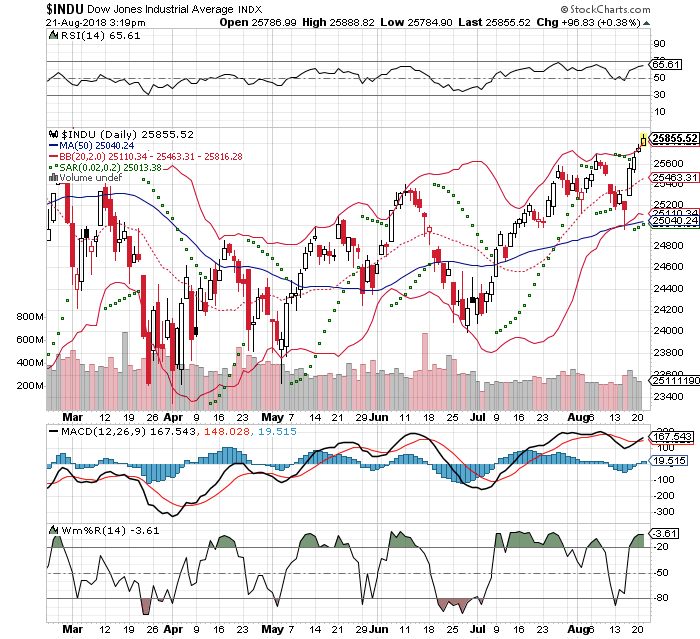
This is another reason why it’s essential to confirm your findings at all times.
The other downside is that the indicator does not provide much insight or signal during sideways trending assets and markets. With no trend, you’ll see the SAR flip-flop back and forth without any clear indication of what’s happening.

