Three of the Most Consistent Candlestick Patterns to Understand

Candlestick patterns may have some odd names.
Abandoned baby bottom, three black crows, dark cloud cover, for example. But these are some of the most powerful tools you can add to your strategy, including these three.
Candlestick Pattern No. 1 – The Doji Cross
Doji crosses are a sign of indecision of bulls and bears. And when found at the top or bottom of trend, it can indicate that a reversal may be nearing. However, as with any technical indicator, confirmation is key. For example, it’s best to confirm with other indicators such as over-extensions on Bollinger Bands (2,20), MACD, relative strength (RSI) and Williams’ %R.
However, as you can see such crosses on a chart provide consistent data for potential reversals.
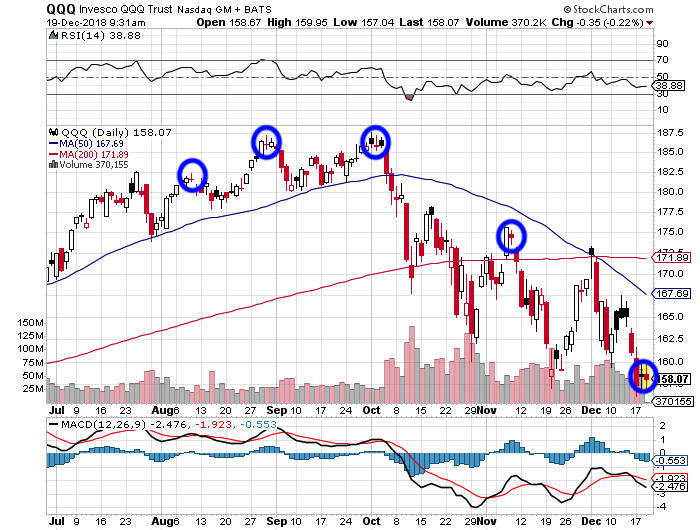
For example, as you can see in this chart of the QQQs, a doji cross marked top of trend at least four times since August 2018.
Candlestick Pattern No. 2-- The Hanging Man
The Hanging Man is a bearish candle that can form at top of trend. It’s typically created when we find a significant sell off near the market open at top of trend. As the day progresses, buyers begin to force the stock higher to its initial opening prices.
When we see this candlestick, it can be an indication that the bulls are just beginning to lose control and demand for the stock or other asset is starting to fall apart. Since the pattern is observed after a push higher, it signals that selling pressure is starting to increase.
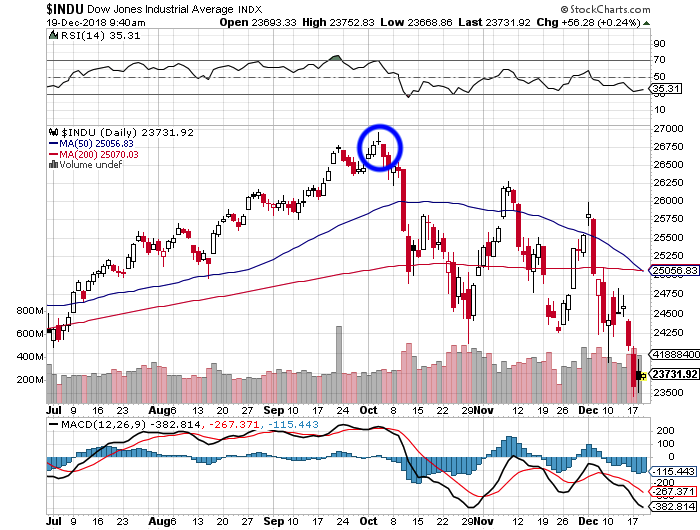
For example, we can see one following a doji cross at top of trend in early October 2018. Following its appearance, the Dow Jones fell from 26,750 to 25,056.
Candlestick Pattern No. 3 – Three White Soldiers
This is one of the oddest named candlesticks, but it can be one of the most powerful.
We can clearly see them at the tail end of this six-month chart of Bitcoin (BTC). This pattern is typically seen as a bullish candlestick pattern after a strong pullback. If it can maintain this pattern, Bitcoin could stage another big rally following its decline.
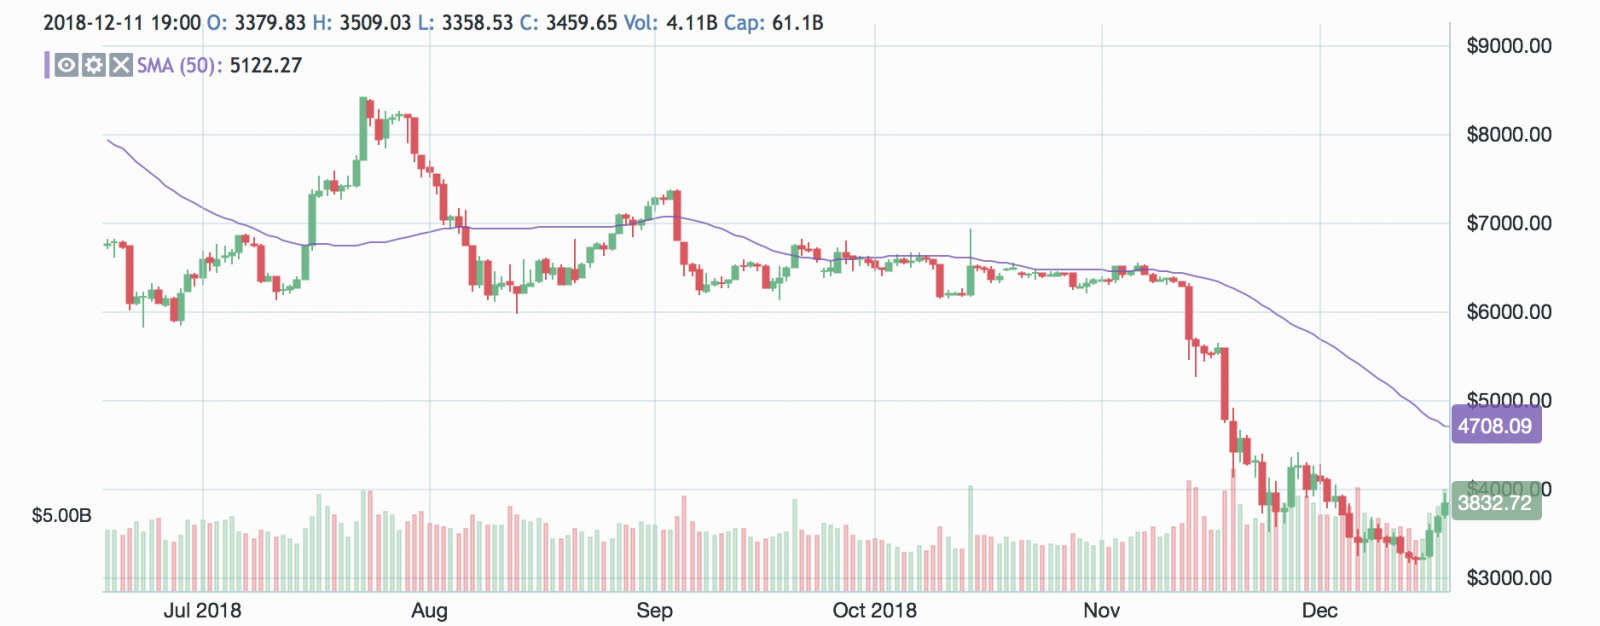
Typically, the three white soldiers consist of three large bullish candles, each closing higher than the last one. Each candle opens within the body of the one preceding it.
Again, though, never rely on just one indicator – such as a candlestick. Always be sure to confirm your findings with other indicators, such as Bollinger Bands, MACD, relative strength (RSI) and Williams’ %R.


