
Get updates on
new Options articles geared
at improving your trading consistency by providing your email address below!
by registering you agree to our
Privacy Policy
Trading the J-Hook Continuation Pattern
Technical analysts attempt to predict direction by studying past price action and charts. And understandably, there are critics. In fact, some see it a pseudo-nonsense.
How to Use the Chaikin Oscillator to Analyze Markets
Any time you use technical analysis, confirmation is essential.
If you’re not willing to confirm, you’re doing yourself a great disservice. In fact, at no time will I ever just use Bollinger Bands (2,20), MACD, relative strength, or Williams’ R% alone.
That’s an amateur, foolish move.
The Most Essential Part of Any Trade
Any one can trade a stock.
But it takes a disciplined person to trade that stock well.
One of the biggest issues facing all walks of traders is a severe lack of discipline and structure in stock buying habits. Many fail to use stop losses, or even protect gains with a simple trailing stop loss strategy. Others risk far too much.
How to Trade Parabolic Stop and Reverse (SAR)
The Parabolic Stop and Reverse (SAR), commonly known as Parabolic SAR is a trend following indicator that highlights current price direction.
It also provides entry and exit signals as well with dotted lines.
The Exact Time to Jump Out of Any Trade
It’s not about having the perfect strategy.
It’s about the rule you abide by with each trade.
One of the biggest issues facing all walks of traders is a severe lack of discipline and structure in stock buying habits. Many fail to use stop losses, or even protect gains with a simple trailing stop loss strategy. Others risk far too much.
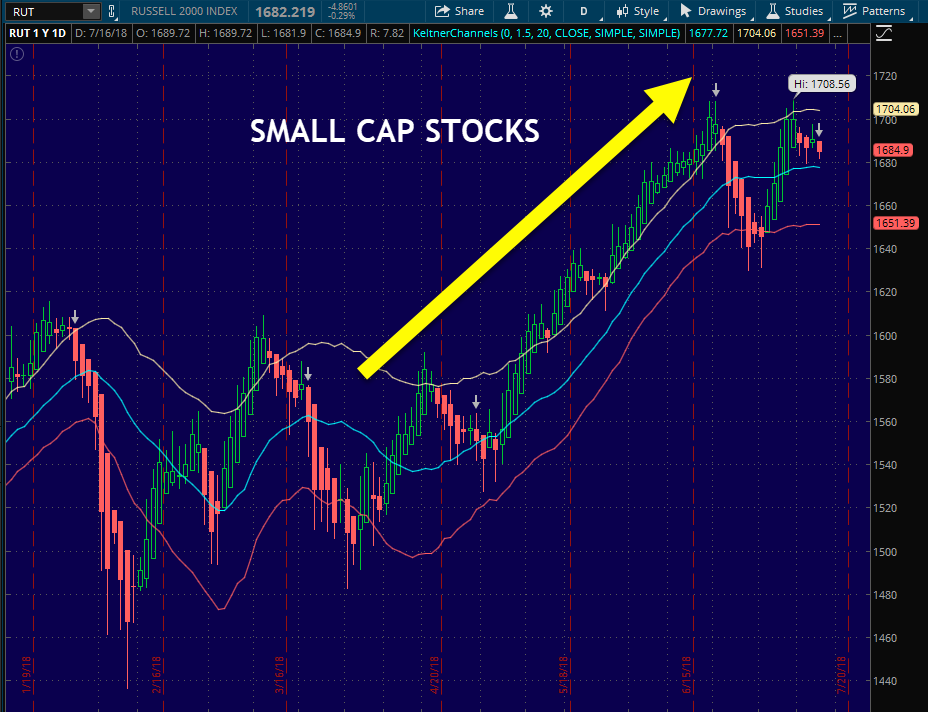
Three Reasons Small Caps are Booming
Small-cap stocks have been unbelievable this year, hitting new highs in June 2018.
In fact, the Russell 2000 is up 9% on the year through July 16, 2018.


