

Get updates on
new Options articles geared
at improving your trading consistency by providing your email address below!
by registering you agree to our
Privacy Policy
Never Panic at the 50-Day Moving Average
Volatility was alive and well in early 2018.
After a stellar, explosive run to 26,500 in early 2018, we sank nearly 3,000 points to challenge the psychological line in the sand at the 50-day moving average when all was said and done.
Granted, the Dow could always catch triple bottom support and turn higher.

The Importance of Flag and Pennant Setups
We’re often told that technical analysis is worthless, or that it’s just a guessing game.
It’s the same argument over and over again.
But as proven time and time again, technical analysis with pattern recognition can lead to some amazing returns. In fact, simply using a combination of Bollinger Bands (2,20), moving average convergence divergence (MACD), relative strength (RSI), and Williams’ %R (W%R) can pinpoint reversals after bouts of excessive fear and greed 80% of the time.
Even simply double tops and bottoms can pinpoint exact points of entry.
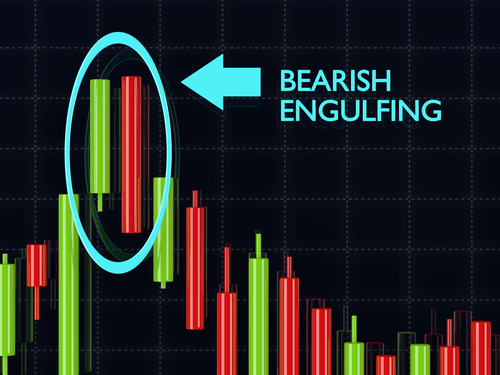
Engulfing Candlesticks: How to Spot Them and What They Mean
To the average trader, candlestick patterns are a bunch of crosses and odd shapes with bizarre names, like the three black crows, or the abandoned baby bottom.
But as odd as they may sound, they can provide powerful insight into direction.
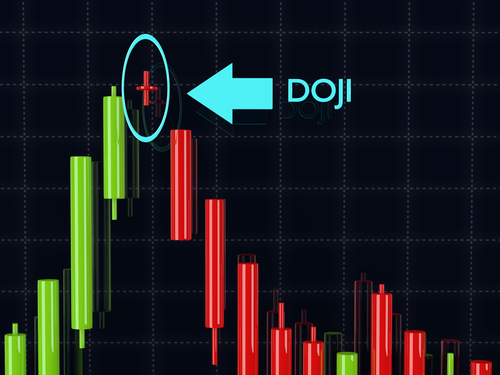
For example, one of the oddest ones is the doji cross. But if you spot one of these at top or bottom of trend, you may have uncovered an opportunity to trade a trend reversal. The profit stars, more commonly known as dojis, are commanding reversal signals. These are formed when the candlestick opens and closes at the same level, implying indecision in the stock price.
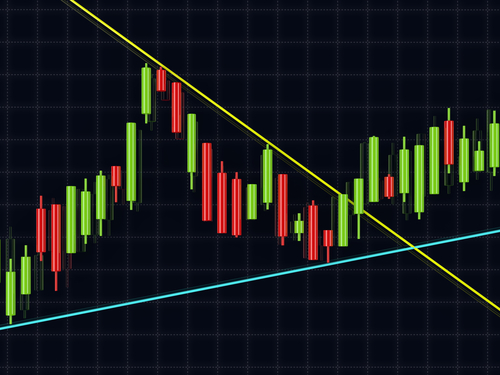
Two Essential Technical Patterns to Follow at All Times
It is essential that you’re well aware of support and resistance points.
If not, you could be setting yourself up for abysmal failure.
Support represents the moment when buying begins to overwhelm selling and prices begin to bounce back. Resistance represents the moment when selling begins to overwhelm buying and prices begin to pivot.
Fibonacci Trading Made Easy
No one ever said technical analysis was easy.
But over time, with practice, the easier it becomes.
For months, we’ve introduced you to several technical tools. However, the one we get the most questions about are Fibonacci retracements. To many, this took is considered complex and outdated. But to be very honest, it’s not complex at all once you practice with it.
Three of the Most Consistent Candlestick Patterns
When Munehia Homma first created candlestick charts in they 1700s, he had no idea it’d change the way we look at stocks 300 years later.
To him, candlestick charting was meant for the rice trade.
He’d record the opening day’s price of rice, the low and the close. And over time, he’d begin to see price patterns in his recordings, mapping out repetitive signals in the price bars. He’d soon give them names, like spinning tops, dojis, and hanging man – candlestick names we still use to this day. The discovery of such patterns helped him successfully predict future direction of rice prices, giving him a significant advantage over other traders.