Fibonacci Trading Made Easy

No one ever said technical analysis was easy.
But over time, with practice, the easier it becomes.
For months, we’ve introduced you to several technical tools. However, the one we get the most questions about are Fibonacci retracements. To many, this took is considered complex and outdated. But to be very honest, it’s not complex at all once you practice with it.
Typically, Fibonacci levels are based on the belief that stocks, and indexes have a tendency to retrace prior moves. To find our points of reference, we must first identify two extremes on a chart, including the peak and trough. Then, we must divide by key Fibonacci ratios, such as 23.6%, 38.2%, 50%, 61.8%, and 76.4%.
Once those levels are identified, we then draw our horizontal lines at each % marker to define points of support and resistance. The goal is to help traders determine critical points where a stock is likely to move up or down based on historical support and resistance.
We can illustrate its effectiveness as a great tool with stocks like AT&T (T) for example.
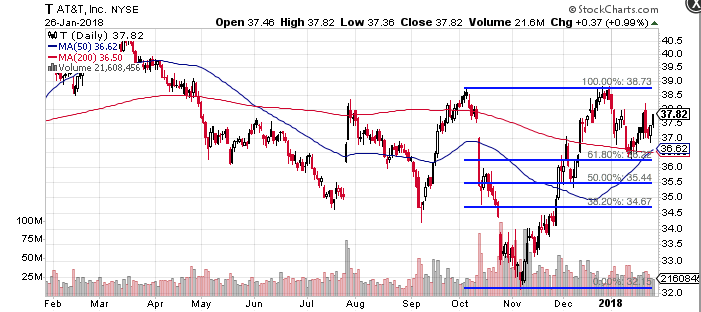
We begin by finding our peak and trough. We then draw our horizontal lines, which help us identify areas of support and resistance. We can then begin to see the critical points at which the stock has found support and resistance since October 2017 for example.
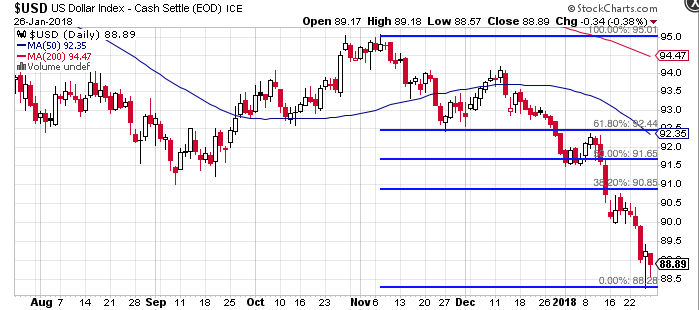
Notice how the retracement levels clearly define support and resistance points along the way. We can see that the currency broke below its 61.8% retracement line, giving us firm indication of further potential weakness.
We can also use the Fibonacci retracements with currencies, too.
While the US Dollar was an absolute disaster between November 2017 and January 2018, we can still clearly see how well Fibonacci retracements lines illustrated support and resistance.
The question then becomes, “should such an indicator be used alone?”
And the answer is always, “no.”
There will never be a time when it’s okay for a sole technical indicator to be used. Instead, to get a fuller picture, use retracements with other tools such as Bollinger Bands, relative strength (RSI), MACD, Money Flow (MFI), or even Williams’ %R (W%R).
It’s just another strong tool to keep in your trading arsenal.


