The Importance of Flag and Pennant Setups

We’re often told that technical analysis is worthless, or that it’s just a guessing game.
It’s the same argument over and over again.
But as proven time and time again, technical analysis with pattern recognition can lead to some amazing returns. In fact, simply using a combination of Bollinger Bands (2,20), moving average convergence divergence (MACD), relative strength (RSI), and Williams’ %R (W%R) can pinpoint reversals after bouts of excessive fear and greed 80% of the time.
Even simply double tops and bottoms can pinpoint exact points of entry.
For example, look at Amgen (AMGN).
On a pullback to $165 a share in May 2018, the stock found and held the same support line dating back to August 2018. Each time it falls to that level, support sends it back up.
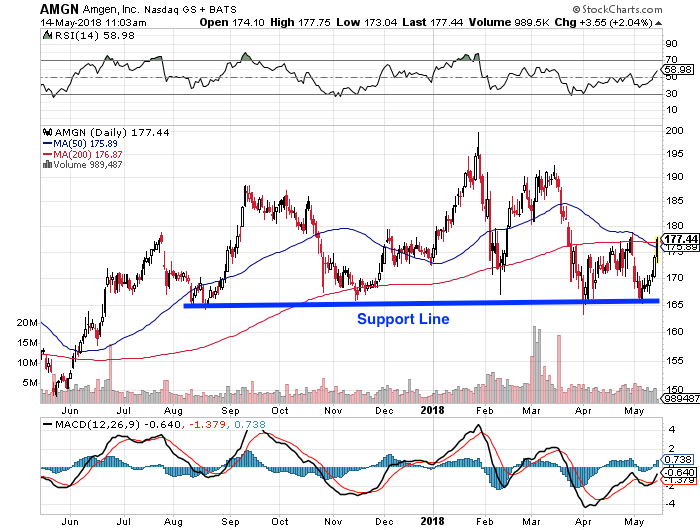
Fundamental analysis alone would not have caught that potential move higher.
In short, if you’re avoiding technical analysis because of some antiquated argument that it doesn’t work, you’re missing out on powerful, quick moves in stocks.
There are literally hundreds of setups to be well aware of, including pennants and flags.
The Bull and Bear Flag
A flag pattern can show up in the middle of a trend and often give you another opportunity to buy. Typically, a flag will show up when the price of a stock moves up (bull) or down (bear) in a strong trend, but then pauses.
The price of the stock will then trade sideways in a narrow, sometimes sloping range. Drawn trend lines will represent support and resistance, as the stock is narrowing will form a rectangular shape – much with the look of a flag.
Eventually, the price will break out of the flag pattern and continue the original paused trend. However, as with any other technical pattern, there’s no such thing as a perfect indicator. That being the case always be sure to confirm your findings and wait for confirmation of potential trend change.
With the flag pattern, we have a bull and a bear flag.
The bullish flag pattern resembles a flag on a pole. The pole is a result of a vertical rise in the stock with the flag resulting from a period of consolidation.
We can see this briefly in JD.com Inc. (JD), for example.
With a bearish flag, you’ll find these in a down trending stock. The pattern looks like an inverted flag on a pole followed by a period of consolidation.
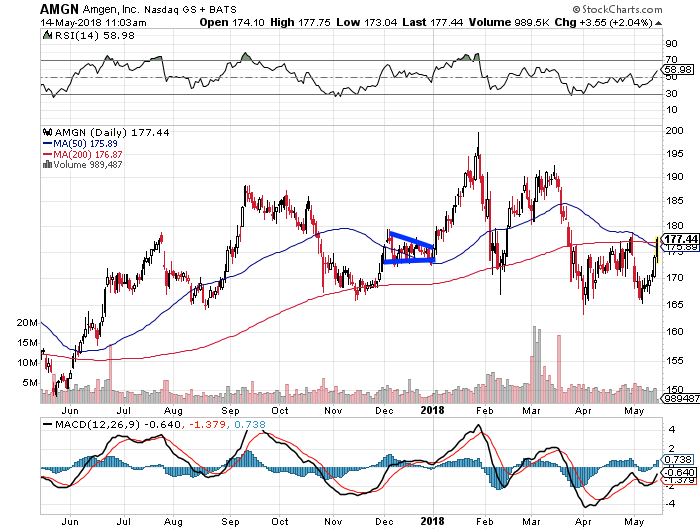
The Pennant Formation
This setup looks like a symmetrical triangle, where support and resistance lines begin to converge towards one another. It’s viewed as a continuation pattern. For example, we can see it briefly in this chart of the Amgen (AMGN) again.
Some of these patterns may sound ridiculous for sure.
But they’ll also point you in the right direction where to make the quickest returns.


