
Get updates on
new Options articles geared
at improving your trading consistency by providing your email address below!
by registering you agree to our
Privacy Policy
How to Spot Market Reversals with Bollinger Bands
If you pull a rubber band too far, too fast, what happens?
It snaps back, right? The same thing happens with stocks, indexes, and currencies. If they’re pulled too far in one direction, eventually they’ll snap back and revert to back to the mean. In fact, we see it happen all the time.
A Sure Way to Know When to Sell High
Buy low, sell high -- it’s an easy rule to follow.
Unfortunately, selling is often the hardest part.
“Jeez, if only I held that stock for one more day. I could have been up another $2,500” is often the thought process. What we fail to consider is that we made money. We accomplished the initial goal. Better yet, we didn’t lose anything.
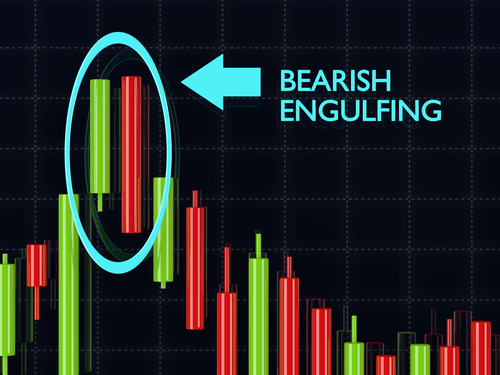
Engulfing Candlesticks: How to Spot Them and What They Mean
To the average trader, candlestick patterns are a bunch of crosses and odd shapes with bizarre names, like the three black crows, or the abandoned baby bottom.
But as odd as they may sound, they can provide powerful insight into direction.
How Options Can Help Minimize Risk
Options are still one of the most misunderstood opportunities.
They’re too hard. They’re far too expensive. You have to be rich to trade them. Those are just some of the excuses I’ve heard over the last 20 years. But to be very honest with you those excuses are laughable.
Always Look for Agreement with These Technical Indicators
I love when traders tell me technical analysis doesn’t work.
While they’re entitled to be wrong, the fact remains that technical analysis does work, sometimes by up to 80% of the time. Granted, there is no Holy Grail, but if we use the right indicators, we increase our odds of success. Especially if we apply those indicators to well known stocks that may only be down temporarily.
Let’s look at Raytheon (RTN) for example.
How to Really Let your Winners Run
We’ve all seen fortunes made.
Unfortunately, we’ve also seen fortunes lost in a matter of seconds.


