

Get updates on
new Options articles geared
at improving your trading consistency by providing your email address below!
by registering you agree to our
Privacy Policy

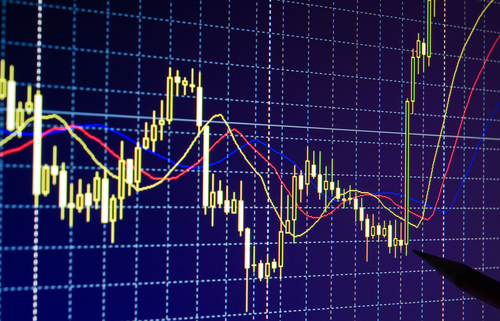
How to Use the Chaikin Oscillator to Analyze Markets
Any time you use technical analysis, confirmation is essential.
If you’re not willing to confirm, you’re doing yourself a great disservice. In fact, at no time will I ever just use Bollinger Bands (2,20), MACD, relative strength, or Williams’ R% alone.
That’s an amateur, foolish move.
Trade Entry: Look for Confirmation with These Indicators
I love when traders tell me technical analysis doesn’t work.
While they’re entitled to be wrong, the fact remains that technical analysis does work, sometimes by up to 80% of the time. Granted, there is no Holy Grail, but if we use the right indicators, we increase our odds of success. Especially if we apply those indicators to well known stocks that may only be down temporarily.
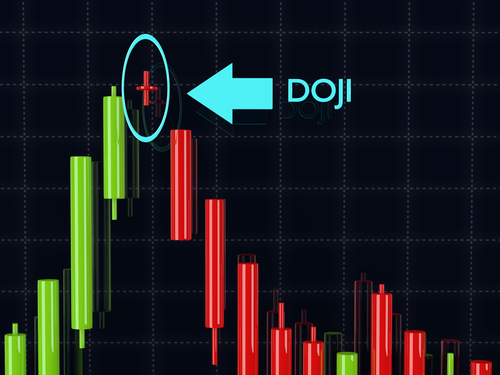
How Candles Can Pinpoint Opportunity
Way back in the 1700s, Munehia Homma first created candlestick charts for rice trade.
Oftentimes, he would record the opening day’s price of rice, the low and the close.
Over time, he’d begin to see price patterns in his recordings, mapping out repetitive signals in the price bars.
Two Essential Technical Patterns to Follow at All Times
It is essential that you’re well aware of support and resistance points.
If not, you could be setting yourself up for abysmal failure.
Support represents the moment when buying begins to overwhelm selling and prices begin to bounce back. Resistance represents the moment when selling begins to overwhelm buying and prices begin to pivot.
Why it Pays to Use these 4 Key Technical Tools
Sometimes, simplicity is the best way to spot opportunity.
Here's an example. In early August 2018, shares of Weight Watchers (WTW) plunged $12 unexpectedly on an earnings overreaction. But the news really wasn’t worthy of such a gap lower.