Two Essential Technical Patterns to Follow at All Times
It is essential that you’re well aware of support and resistance points.
If not, you could be setting yourself up for abysmal failure.
Support represents the moment when buying begins to overwhelm selling and prices begin to bounce back. Resistance represents the moment when selling begins to overwhelm buying and prices begin to pivot.
When it comes to spotting support, look for a series of low points when a stock continues to fall to a certain level, but then doesn’t fall any more. Typically this is support. When it comes to resistance, look for a series of high points when a stock continues to fail at a specific ceiling price.
The more times a stock bounce off support and resistance, the stronger these support and resistance lines become for technical analysis. If something repeats itself again and again, it becomes a stronger indicator of potential pivots at high or low points on a chart.
Two ways to find great support and resistance is through the identification of double tops and bottoms for example. If your stocks bounces off the same support level, or fails at the same resistance level at least twice, we can make an argument for selling or buying said asset at each pivot point.
Look at the Dow Jones Industrial Average (DJIA), for example.
In late May 2018, the Dow Jones ran into trouble at double top resistance points around 25,000. When it failed to push above that resistance level, the Dow began to pull back, falling more than 500 points.
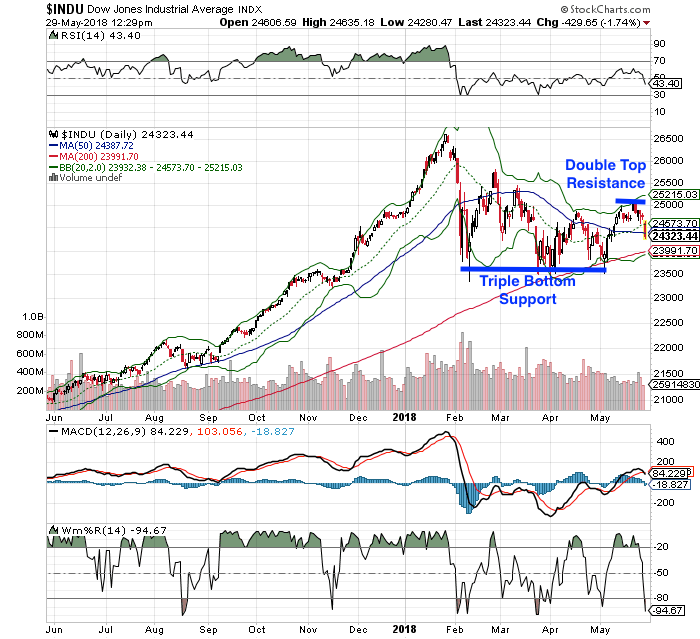
We can also see points where support is quite strong on the index, too. Between February 2018 and early May 2018, we can clearly see triple bottom support – an area where buying overwhelmed selling. Each time the Dow hit that low, it has bounced so far.
Of course, we never want to rely on just one indicator. We want to confirm our findings. To do so, we can begin to look for over-extensions on other technical indicators, such as the Bollinger Bands (2,20) where the Dow failed at the upper Band, as well as Williams’ %R, which pinpointed potential reversal when it was above its 20-line.


