Three of the Most Consistent Candlestick Patterns
When Munehia Homma first created candlestick charts in they 1700s, he had no idea it’d change the way we look at stocks 300 years later.
To him, candlestick charting was meant for the rice trade.
He’d record the opening day’s price of rice, the low and the close. And over time, he’d begin to see price patterns in his recordings, mapping out repetitive signals in the price bars. He’d soon give them names, like spinning tops, dojis, and hanging man – candlestick names we still use to this day. The discovery of such patterns helped him successfully predict future direction of rice prices, giving him a significant advantage over other traders.
While not all traders and investors rely on them, or believe they actually work, they are worth paying attention to for their insight into the psychology of the trade.
There are three that many traders rely on most often.
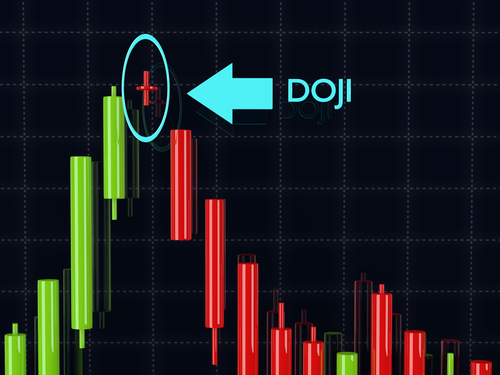
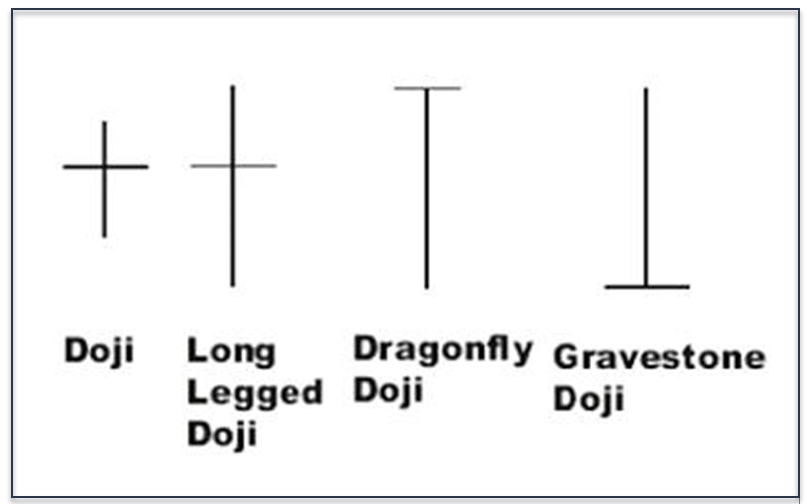
No. 1 – The Doji Cross
Doji crosses are a sign of indecision of bulls and bears. When found at the top or bottom of trend, it can indicate that a reversal in the other direction may be nearing. However, as with any technical indicator, confirmation is key. Typically, when we see a doji at top or bottom of trend, it can be a sign of indecision among the bulls and bears.
They tell us there’s a potential reversal in the stock.
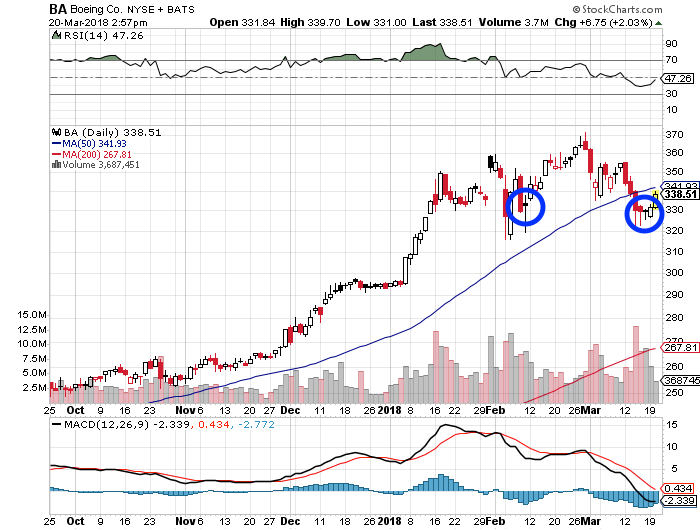
In the case of Boeing (BA), notice the appearance of the long-legged doji cross at the bottom of two major downtrends. The appearance many times was an indication of potential reversal.
No. 2 – The Bullish Engulfing Candle
This one forms when a large white candlestick appears next to a smaller red or black candlestick, engulfing it. What that suggests is that the bulls have now taken control of the stock price from the bears. The pattern will follow a stock price decline, and indicate potential reversal off a low.
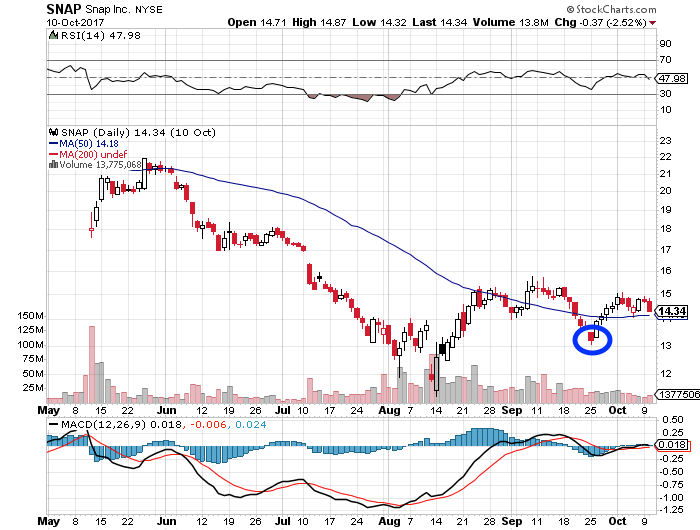
Take a look at Snap Inc. (SNAP), fore example.
Notice the bullish engulfing pattern that began to form at bottom of trend.
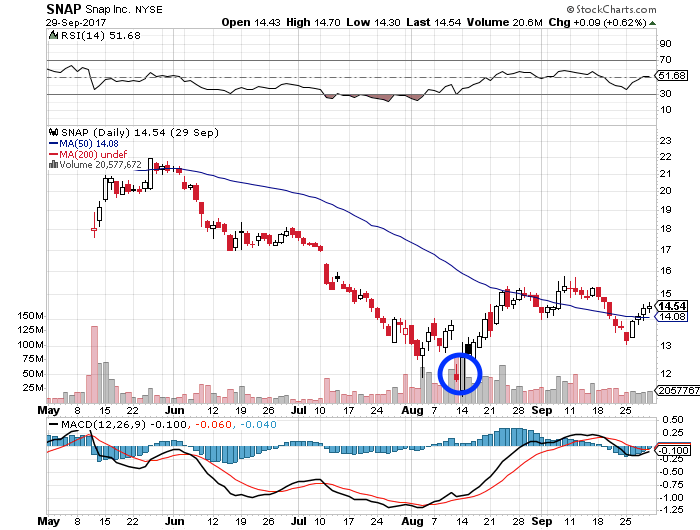
No. 3 – The “Hammer”
There’s also a hammer candlestick, which when found at bottom of trend, can indicate exhaustion of the bears and likely upside.
In simple terms, it’s a signal of capitulation among the sellers and an indication of potential trend change. The signal doesn’t always mean that bullish investors have taken control of a stock, but it does mean that sellers are exhausted and buyers are waking back up. These are most effective when they follow three or more consecutive declining days on trading.
We can see this again in shares of Snap Inc.
Of course, you never want to buy or exit a trade just because a candle appears.
That’s the worst thing you can do.
Instead, always be sure to confirm your findings with other technical indicators, such as Bollinger Bands, MACD, relative strength, Williams’ %R and even money flow.


