Engulfing Candlesticks: How to Spot Them and What They Mean
To the average trader, candlestick patterns are a bunch of crosses and odd shapes with bizarre names, like the three black crows, or the abandoned baby bottom.
But as odd as they may sound, they can provide powerful insight into direction.
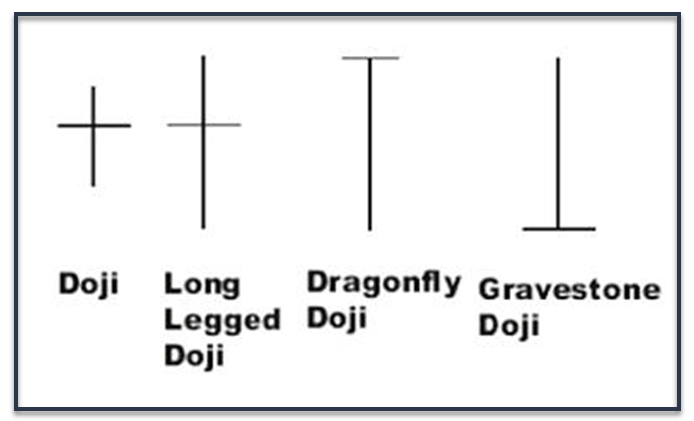
For example, one of the oddest ones is the doji cross. But if you spot one of these at top or bottom of trend, you may have uncovered an opportunity to trade a trend reversal. The profit stars, more commonly known as dojis, are commanding reversal signals. These are formed when the candlestick opens and closes at the same level, implying indecision in the stock price.
Or, look at the engulfing candlestick pattern, of which there are two types.
There’s the bullish engulfing pattern.
This candle forms when a large white candlestick appears next to a smaller red or black candlestick, engulfing it. What that suggests is that the bulls have now taken control of the stock price from the bears. The pattern will follow a decline, and indicate potential reversal.
We can see a bullish engulfing pattern in the chart of Bitcoin (BTC) for example in late May 2018. Notice here how at the bottom of a downtrend, there’s a with a small red candlestick followed by a large green candlestick that completely eclipses or "engulfs" the previous day's candlestick. That’s a bullish engulfing pattern.
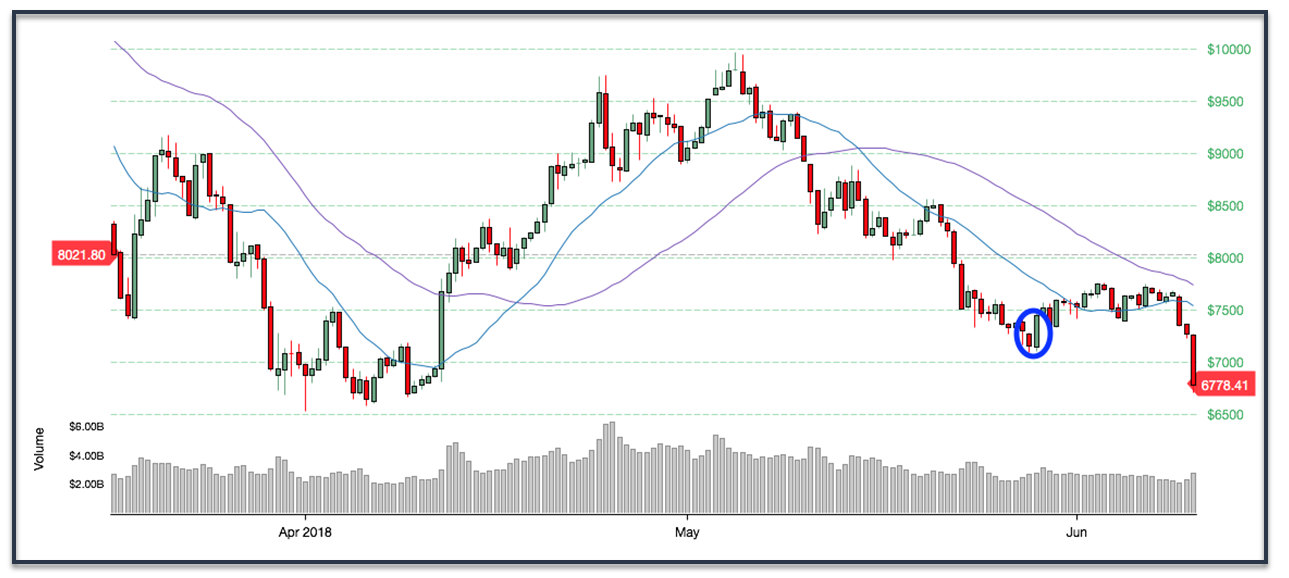
You’ll also notice that after it formed, the price of the BTC rallied from $7,100 to $7,750.
However, as with any indicator, it’s essential that you confirm with other indicators, such as Bollinger Bands (2,20), MACD, Fast Stochastic, and even Williams’ %R.
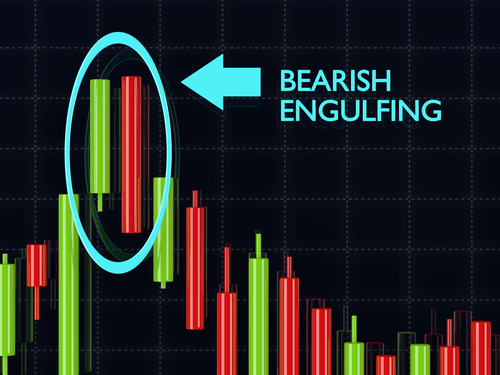
The bearish engulfing pattern is the exact opposite.
This one forms when a large red or black candlestick appears next to a smaller white candlestick, engulfing it. What that suggests is that the bears have now taken control of the stock price from the bears. The pattern will show up after a price runs higher, potentially indicating reversal.
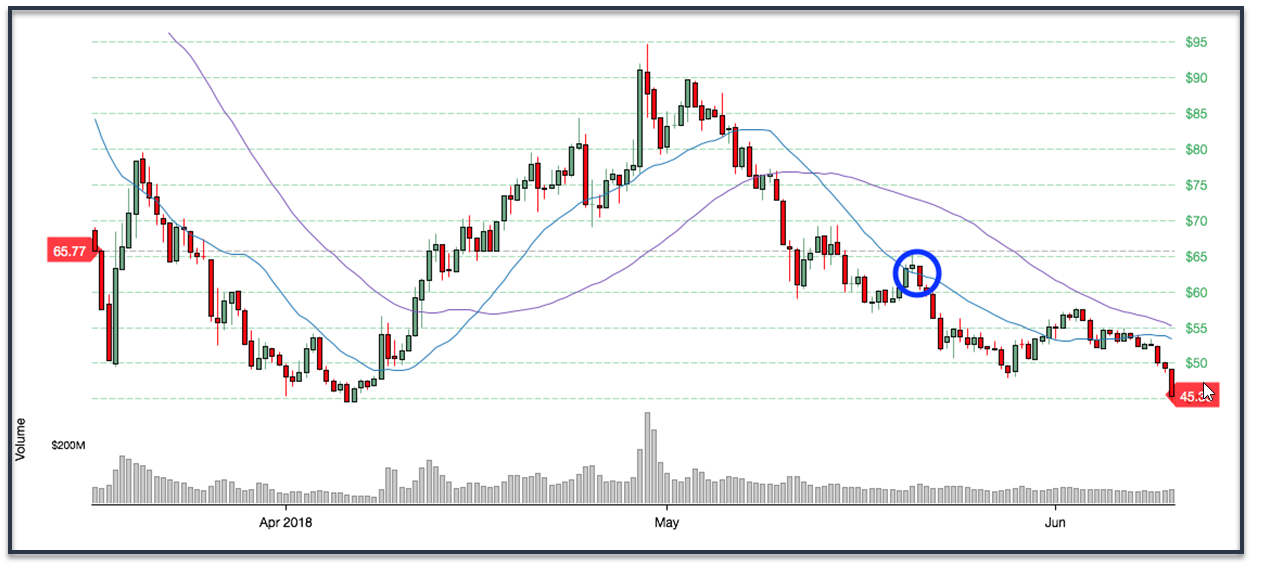
However, just because an engulfing pattern appears, be sure to confirm.
Keep in mind that just because the candle appears at top of trend doesn't mean you should run out and short the stock in question. Instead, confirm the finding by also looking at the position of the stock with regards to Bollinger Bands, moving averages, MACD, relative strength, money flow and Williams’ %R for example.
Also, wait to see a close higher or lower prior to buying what appears to be a change in trend. The last thing you want to get caught up in is a false signal. Remember, to make money in this market, we have to trade well with confirmation.
Or, you’re really just speculating, throwing money at the wall, and hoping something sticks.


