The Importance of Spotting Support and Resistance

The idea that drawing lines on a chart can make you money has been a matter of contention for years. But the fact remains that those lines are quite helpful.
You see, the key to the lines’ effectiveness lies entirely in its popularity among large audiences of traders. We’re talking about thousands, if not millions of traders looking for these very opportunities based on nothing more than support and resistance.
If I know that my favorite stock has bounced at the same price multiple times, I can assume that it has the potential to do the same. Or, if my favorite failed at the same point multiple times, it’s a good bet it may happen again.
Typically, we can watch for double and triple tops and bottoms.
To spot where fear may soon give way to greed, we begin to look for double and triple bottoms, for instance. We’ll look for a series of low points when a stock continues to fall to a certain level, but then doesn’t fall any more. If it happens twice at the same level of support, we have a double bottom argument. If it happens three times, we’ve just found triple bottom support.
The same thing happens with double or triple tops. These can typically be found at the peak of an upward trend, followed by a pullback, followed by another test of prior resistance. If it happens twice, we have a double top. If it happens three times… you get the picture. They’re quite useful so don’t ignore them.
Take a look at Canopy Growth (CGC) for example between January 2018 and June 2018. On three occasions the stock fell to about $20 and bounced. That became double bottom support.
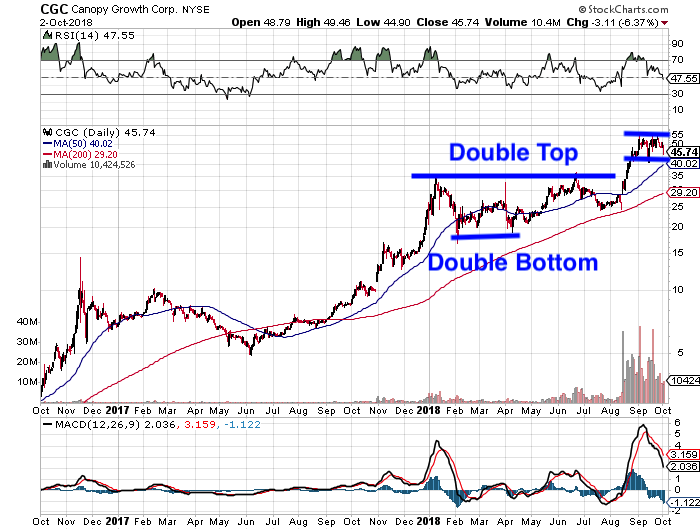
On two other occasions, CGC failed at double top resistance.
Eventually, CGC would break out to $55 a share, where it began to consolidate.
We can also spot opportunity using Wedge Patterns
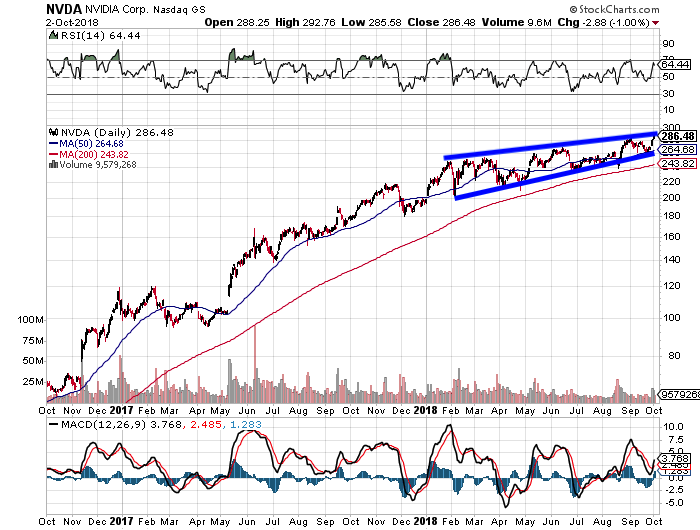
One of the first things to know about rising and falling wedge patterns, is that they’re a great indicator of an upcoming reversal.
Wedge patterns are created with a series of lower lows and lower highs, or higher lows and higher highs. What we want to do here is connect the lower lows and lower highs, which would take the shape of a falling wedge for example. During a falling wedge, wait for the price to break above the upper trendline. At that point, the stock is considered to have broken out.
The pattern is then complete. When this happens, consider a long position.
With a rising wedge pattern, connect the higher highs and higher lows. This will begin to take the shape of a rising wedge. When the stock breaks below the lower trendline, the stock is considered to have broken out to the downside. When this happens, consider a short position.


