Top Technical Indicators for Any Trading Plan

Every time you trade a stock, it’s essential that you understand the psychology of the buyers and seller. If not, you begin to run the risk of losing money.
That’s the last thing any of us want to do.
So, we need to understand if the bulls have gotten ridiculously, and unsustainably bullish. And we need to understand if the bears have begun to lose their minds after a sell-off.
Knowing either can create immense opportunity. It’s at the extremes that we want to carefully examine momentum indicators that tell us a) the bulls are too bullish, or b) the bears have lost their minds, buy here.
We can do that with Bollinger Bands and Williams’ %R.
As we have discussed before, we use Bollinger Bands to see just how far we can stretch our rubber band. The bands are plotted at standard deviation levels above and below moving averages. So if you see “2,20” that simple means the bands are plotted two standard deviations above and below the 20-day moving average.
Loosely explained, when the upper band is challenged, confirmed with other indicators, we can begin to make an argument for a potential pivot lower from the upper band. Or, if the lower band is challenged, confirmed with other indicators, we can make an argument for a potential pivot higher from an oversold point.
Remember, though, confirmation is key. We never want to buy a stock based on a single indicator. That’s a good way to lose money, which none of us want to do.
So, we begin to introduce Williams’ %R (W%R).
W%R is the ultimate momentum indicator that signals oversold and overbought conditions. W%R shows an overbought condition with a numerical range read of 0% to 20%. Oversold conditions are measured with a numerical range read of 80% to 100%.
When we combine the two indicators, we can find tops and bottoms of trend with ease.
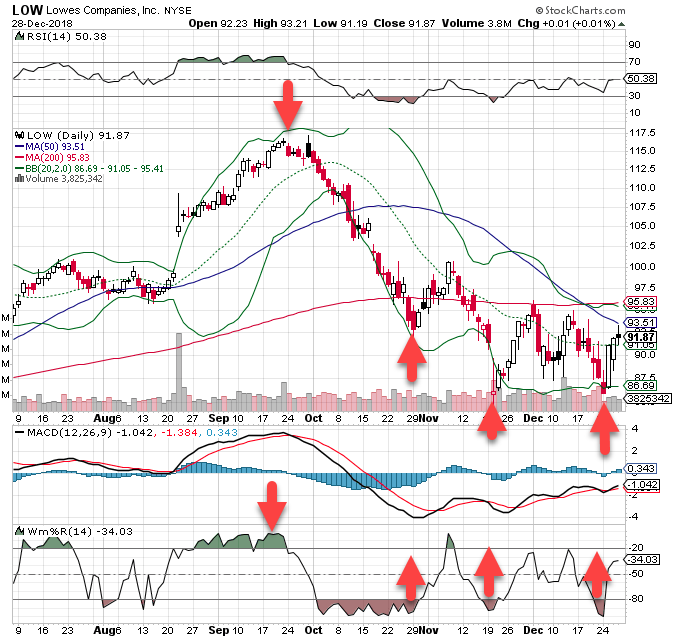
Look at what happens each time the lower Bollinger Band is touched or penetrated, as Williams tests or penetrates its 80-line. On many occasions, the stock bounces back.
Or look at what happens when the upper Bollinger Band is tested or penetrated to the upside, as Williams’ tests or penetrates its 20-line. The stock begins to pivot.
It doesn't happen 100% of the time, but it’s still something to keep an eye on.


