How to Use the Chande Trend Meter (CTM) with 80% Success

Unbelievably, technical analysis is still written off as useless.
In fact, some denounce it as a laughable study of charts, patterns, and squiggly lines without any concrete or profitable results. Others argue it’s only good for short-term trading.
However, none of that is true.
We’ve proven that time and time again, with chart after chart. As a matter of fact, if we simply use a combination of Bollinger Bands, relative strength, MACD, and Williams’ %R, it produces a short- and long-term success rate as high as 80%.
While fundamental analysis is good to use, it won’t hand you results that quickly without waiting around and hoping. That’s not to discount the usefulness of fundamental investors. In fact, we often suggest combining both schools of thought to spot the best opportunities on market.
The reason we abide by technical analysis so much is because it gives us a clear picture of market psychology. After all, all markets are driven chiefly by the psychology of fear and greed.
So why not take full advantage of it?
While we can take advantage of that herd psychology with the above-mentioned indicators, we can also look at the Chande Trend Meter (CTM).
Much like RSI, MACD and Williams’ %R, we’re using CTM to spot points of excessive fear and excessive greed. Its readings are bound between a range of -100 and +100. The closer the to -100, the more oversold the security is considered. The closer we get to +100, the more overbought the security is considered.
Let’s use the Dow Jones Industrial Average (DJIA) for example with a two-year chart.
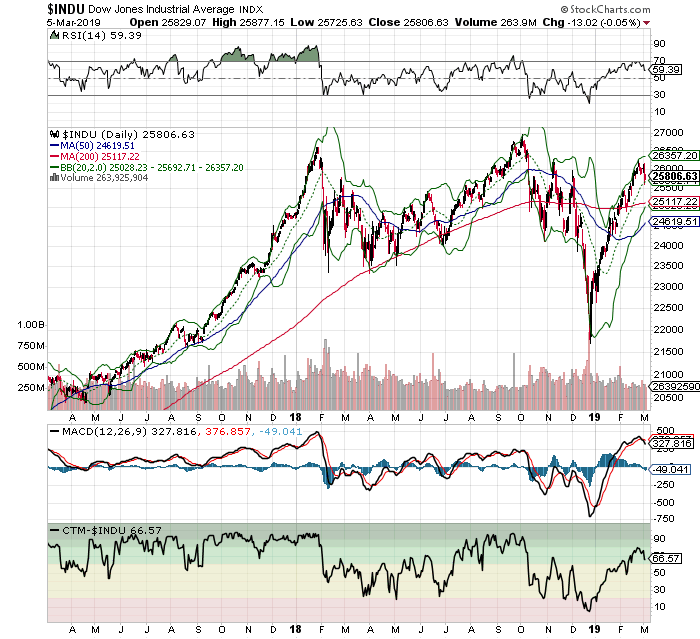
And of course, let’s also use CTM to confirm what Bollinger Bands (2,20), MACD, RSI, and Williams’ %R are saying. Remember, we never want to use just one indicator to buy or sell.
Look at what happens when the DJIA hits its upper Band, as RSI hits its 70-line, and as MACD becomes over-extended with CTM at or above 90. Up to 80% of the time, the DJIA will pivot.
Now look at things in reverse.
Up to 80% of the time when the DJIA hits its lower Band with RSI at 30, MACD over-extended, and CTM is at its 10-line. Again, the DJIA begins to pivot and reverse.
It doesn’t matter what others think of technical analysis.
Using it and knowing it works is what leads to consistent success. Let others just use fundamentals and wait for paint to dry, as they wait for big returns. Not only will technicians make money from a short-term move, but a long-term move, too.


