Three Key Technical Indicators all Traders Should Use

Oftentimes, technical analysis is written off as worthless.
However, as it has been proven time and time again, it should never be ignored because it gives us a very clear, defined picture of fear and greed. Or, the very psychology that drives stocks.
In fact, by simply using a unique combination of Bollinger Bands, MACD, Relative Strength, and Williams’ %R, we can spot pivots up to 80% of the time. However, it always pays to confirm even those indicators. Here are three other technical points to be well aware of.
No. 1 – Ease of Movement (EMV)
With EMW, a move below the zero line is bearish. A move above the zero line is bullish.
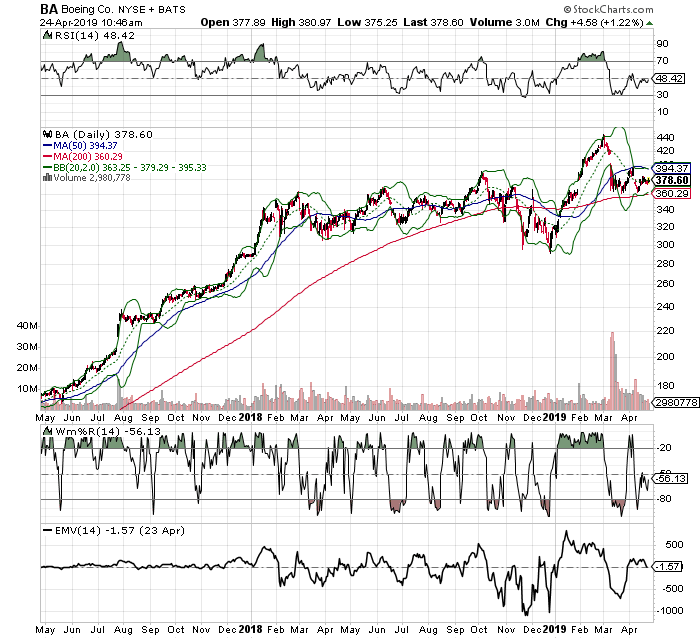
Let’s use a two-year chart of Boeing (BA) for example. Here, we can clearly see that any time EMV drops to a historical low of -500, and agrees with RSI, W%R, and Bollinger Bands, we see a pivot up to 80% of the time. Then, when EMW moves to or above +500, and agrees with RSI, W%R, and the Bollinger Bands, we again see a near-term pivot.
No. 2 – Money Flow Index (MFI)
One way to pinpoint when either is likely to happen is by paying attention to MFI, or the Money Flow Index, which helps indicate the strength of money flowing in or out. For example, if MFI is below 20, the stock is considered oversold. If MFI is above 80, the stock is overbought.
About 80% of the time, when Money Flow dips well into oversold territory with a well-respected stock, it’s likely to bounce higher. Look at Glu Mobile (GLUU), for example.
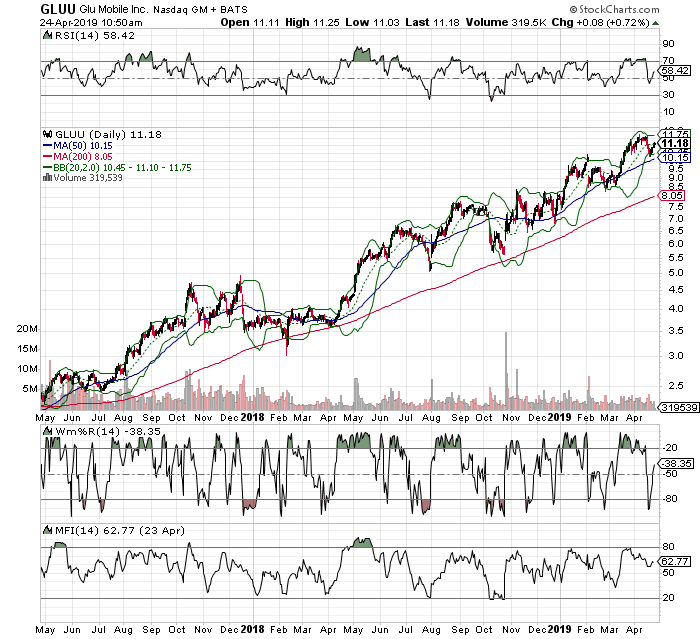
Look at what happens each time MFI pushes to or above the 80-line. The stock begins to pivot and reverse lower, as it becomes clear that money is about to flow out of the name on excessively overbought conditions. Or, look at what happens to the stock when MFI drops to or below the 20-line. The stock begins to bottom out, pivot and turn higher.
No. 3 – Chande Trend Meter (CTM)
We can use CTM to spot points of excessive fear and greed. Its readings are bound between a range of -100 and +100. The closer the to -100, the more oversold the security is considered. The closer we get to +100, the more overbought the security is considered.
Let’s again use a two-year chart of Boeing (BA).
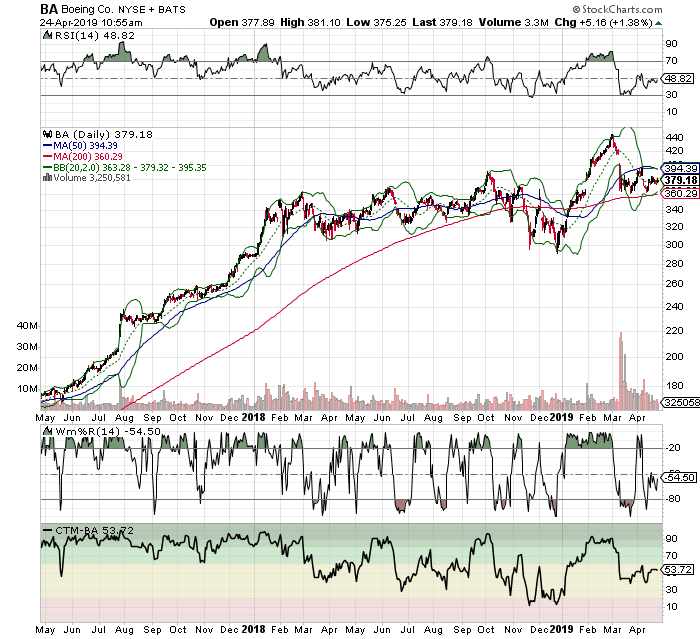
Any time it pushes to historical resistance at 90, and agrees with other technical indicators in overbought regions, we see a near-term reversal. With regards to bottoms, it’s always best to watch historical lows of 30 and below.


