Three of the Most Powerful Candlesticks to Use
When Munehia Homma first created candlestick charts in the 1700s, he had no idea it’d change the way we look at stocks 300 years later.
To him, candlestick charting was meant for the rice trade.
Now, when applied to technical analysis, it can help give us a clear picture of trader emotion. In fact, some of the most powerful candlesticks we use today include:
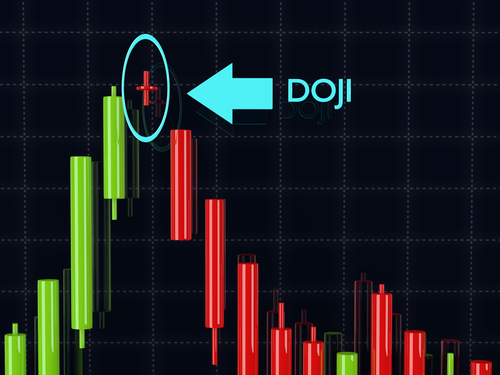
No. 1 – The Doji Cross
Doji crosses are a sign of indecision of bulls and bears. When found at the top or bottom of trend, it can indicate that a reversal in the other direction may be nearing. However, as with any technical indicator, confirmation is key. Typically, when we see a doji at top or bottom of trend, it can be a sign of indecision among the bulls and bears.
They tell us there’s a potential reversal in the stock.
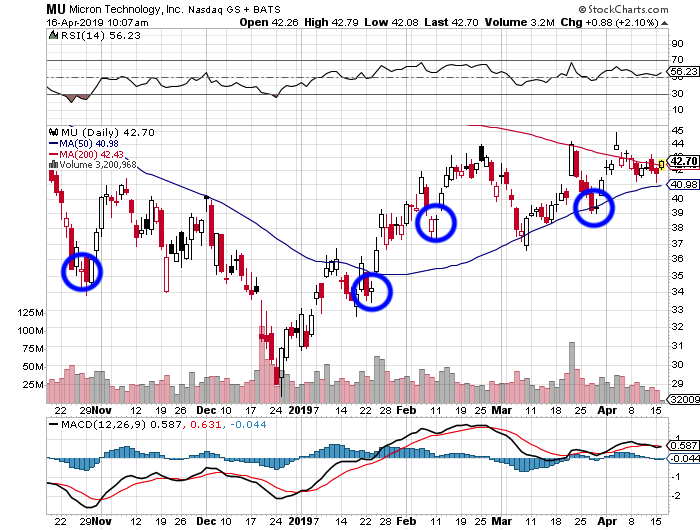
We can see these crosses in Micron Technology for example at tops and bottoms, which lead to reversals shortly thereafter.
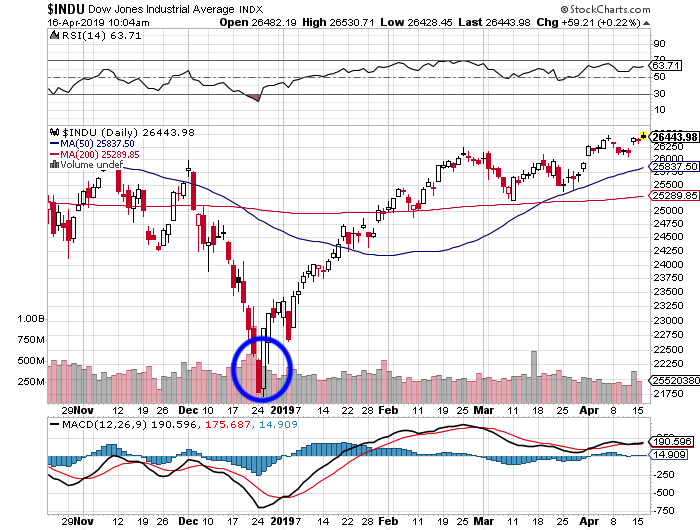
No. 2 – The Bullish Engulfing Candle
This one forms when a large white candlestick appears next to a smaller red or black candlestick, engulfing it. What that suggests is that the bulls have now taken control of the stock price from the bears. The pattern will follow a stock price decline, and indicate potential reversal off a low.
For example, we can see a clear bullish engulfing candlestick at the bottom of trend on the Dow Jones Industrial Average (DJIA). In fact, it helped call the bottom after a severe sell-off from 26,000 to 21,750 in late December 2018.
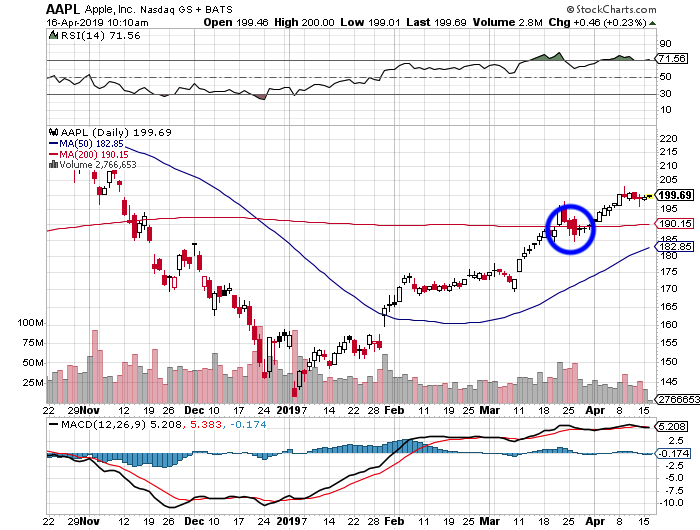
No. 3 – The “Hammer”
There’s also a hammer candlestick, which when found at bottom of trend, can indicate exhaustion of the bears and likely upside.
In simple terms, it’s a signal of capitulation among the sellers and an indication of potential trend change. The signal doesn’t always mean that bullish investors have taken control of a stock, but it does mean that sellers are exhausted and buyers are waking back up. These are most effective when they follow three or more consecutive declining days on trading.
We can see a hammer in this chart of Apple for example.
Of course, you never want to buy or exit a trade just because a candle appears.
That’s the worst thing you can do.
Instead, always be sure to confirm your findings with other technical indicators, such as Bollinger Bands, MACD, relative strength, Williams’ %R and even money flow.


