Bollinger Band and Keltner Channel Trading: Similarities and Differences

Imagine jumping off a bridge with a bungee cord.
As you begin to reach the end of the cord’s pull, you’re quickly yanked in the other direction.
That very same thing happens with stocks when they become far too extended in overbought or oversold territory. And we judge exactly where that’s likely to happen with two key indicators.
One is known as the Bollinger Band.
The other is known as the Keltner Channel.
The Bollinger Band
When it comes to Bollinger Bands (plotted at standard deviation levels above and below moving averages), stock prices tend to stay within the upper and lower bands. Bollinger Bands allow users to compare volatility and relative price levels over a period of time. They consist of three bands:
- A simple moving average (SMA) in the middle
- An upper band (SMA plus 2 standard deviations)
- A lower band (SMA minus 2 standard deviations)
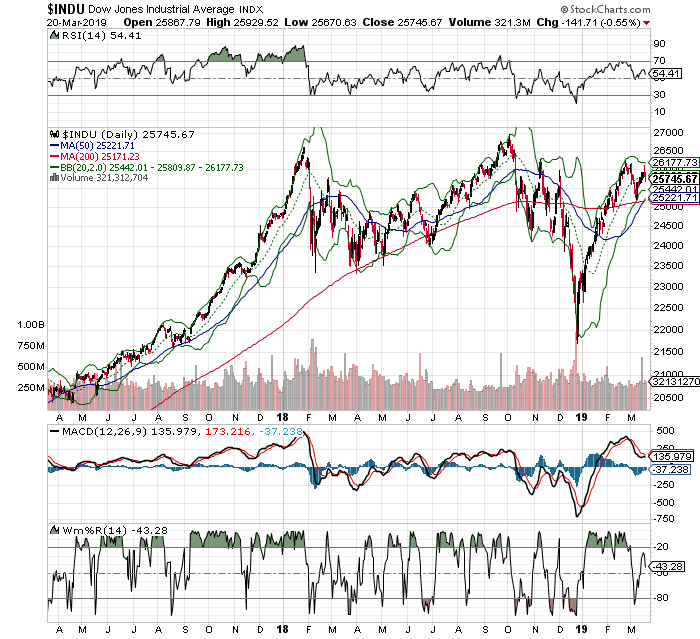
Look at the Dow Jones Industrial Average (DJIA) for example.

Notice what happens about 80% of the time when the upper or lower Band is touched or penetrated. It pivots and reverses.
We can also look at the Keltner Channel (KC).
Keltner Channels
Keltner Channels are volatility-based lines set above and below an exponential moving average (EMA). This indicator is similar to Bollinger Bands. Instead of using the standard deviation, though the KC use the Average True Range (ATR) – which looks at the degree of price volatility -- to set channel distance.
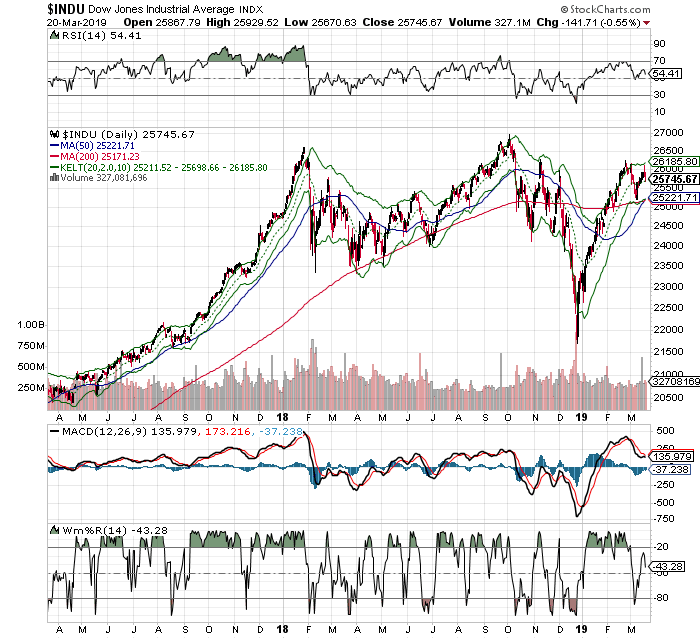
We can again look at the DJIA and see that the stock also stays within the parameters of the Keltner Channel, just as it does with Bollinger Bands.

However, we never just want to rely on either as a sole indicator. We want to always confirm with other indicators to be safe. In fact, we can use relative strength (RSI), MACD, Money Flow (MFI), Williams’ %R and even fundamental analysis as confirmation.


