How to Spot Overbought Pivots up to 80% of the Time

With the incredibly popular Avengers: Endgame film, shares of Disney Co. exploded from a low of $107.50 to $142.50 in April 2019.
After the film grossed $1.2 billion in its opening weekend (biggest in history), analysts were still seen raising price targets. JP Morgan noted the stock could run to $150 a share by the end of the year. The firm also increased its full-year earnings estimates to $6.80 a share from $6.69 thanks to better than expected film performances in the year. For 2020, the analysts hiked their estimates to $6.50 from $6.35 a share, as well.
In addition, ahead of Disney’s May 8, 2019 earnings announcement, JP Morgan increased its earnings estimates to $1.67 from $1.63 thanks in part to the success of the Captain Marvel film.
Analysts at Cowen note that estimates could add between 10 and 12 cents to 2019 EPS. “More importantly ’Endgame’ will be on Disney+ when it launches and we think it will be one more big draw to get people to sign up,” noted analysts who now have an outperform rating on the stock with a price target of $154.
Analysts at B. Riley FBR noted that Endgame made $66 million more that expectations.
While there was considerable reason for bullishness, fundamentally, there were also arguments for downside on technical considerations.
Technical Pivot Points Told Us the Stock was Overbought
After a considerable move higher, we can see just how overbought the stock is.
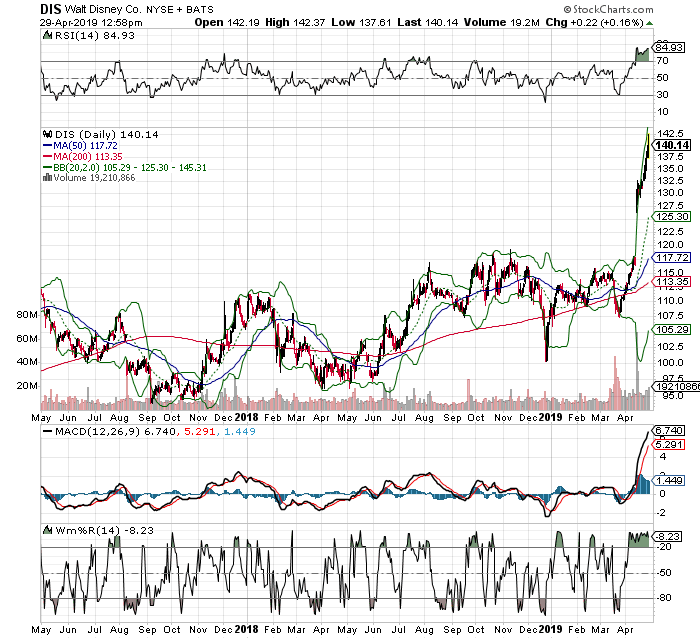
For one, DIS is now outside its upper Bollinger Band (2,20). Historically when it gets to that upper Band, the stock has tendency to pullback. That happens up to 80% of the time.
However, we never want to simply rely on a sole indicator.
So, we also look at Relative Strength (RSI) as well. When RSI gets as overbought at or above the 70-line, we see a reversal as well. With it well above its 70-line, that’s a sign of an extremely overbought condition.
We can also look for over-extensions on MACD.
For example, the MACD spike in April 2019 is an unsustainable one.
Williams’ %R (W%R) is also well above its 20-line, which is another indication of an extremely overbought condition.
With all of those technical pivot points in agreement, we can often tell with up to 80% of the time when a stock is likely to pivot lower.


