

Get updates on
new Options articles geared
at improving your trading consistency by providing your email address below!
by registering you agree to our
Privacy Policy

Using the Parabolic SAR to Identify Entries and Exits
The Parabolic Stop and Reverse (SAR), commonly known as Parabolic SAR is a trend following indicator that highlights current price direction.
It also provides entry and exit signals as well with dotted lines.

Three of the Best Ways to Hedge for Market Downside
Markets are a fickle beast.
Even when the U.S. and China neared a trade deal, markets began to pull back in March 2019.
While many shifted blame to the President for the move lower, we had to consider that markets were technically stretched. We were overdue for a pullback.

How to Spot Market Reversals with Bollinger Bands
If you pull a rubber band too far, too fast, what happens?
It snaps back, right? The same thing happens with stocks, indexes, and currencies. If they’re pulled too far in one direction, eventually they’ll snap back and revert to back to the mean. In fact, we see it happen all the time.
Two Essential Technical Patterns to Follow at All Times
It is essential that you’re well aware of support and resistance points.
If not, you could be setting yourself up for abysmal failure.
Support represents the moment when buying begins to overwhelm selling and prices begin to bounce back. Resistance represents the moment when selling begins to overwhelm buying and prices begin to pivot.
Technical Analysis 101: Two of the Most Essential Moving Averages
When it comes to technical analysis, moving averages are essential.
For example, for more than 20 years, I’ve relied on two specifically – the 50-day and the 200-day simply moving average. Not only am I looking for crossovers for golden and death crosses, I want to see if a stock is holding its own above them.
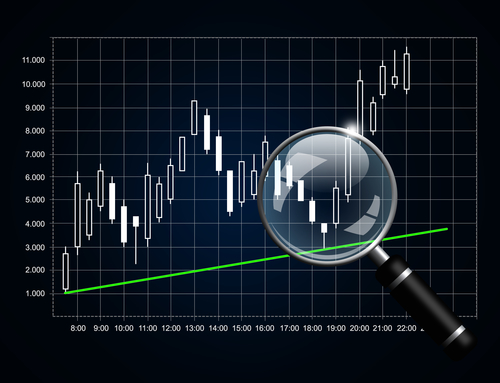
How Candles Can Pinpoint Opportunity
Way back in the 1700s, Munehia Homma first created candlestick charts for rice trade.
Oftentimes, he would record the opening day’s price of rice, the low and the close.
Over time, he’d begin to see price patterns in his recordings, mapping out repetitive signals in the price bars.