How Candles Can Pinpoint Opportunity
Way back in the 1700s, Munehia Homma first created candlestick charts for rice trade.
Oftentimes, he would record the opening day’s price of rice, the low and the close.
Over time, he’d begin to see price patterns in his recordings, mapping out repetitive signals in the price bars. He’d soon give them names, like spinning tops, dojis, and shooting stars. Interesting to note, the discovery of the patterns helped him successfully predict future direction of rice prices, giving him an advantage over other rice traders.
Little did he know that 318 years later, we’d find a bigger use for them with stocks.
While not all traders rely on candlestick charts, many do for greater insight into opportunity.
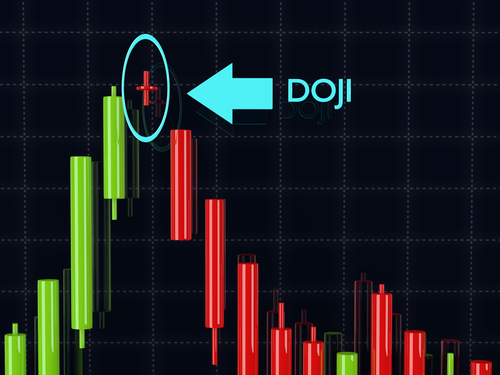
One of my personal favorites is the doji cross.
These take the appearance of crosses. And while they may not mean anything to the average Joe, to an experienced trader, they can pinpoint reversals. Typically, they are signs of indecision. When found at bottom or top of trend, they can tell us that a trend may be about to change.
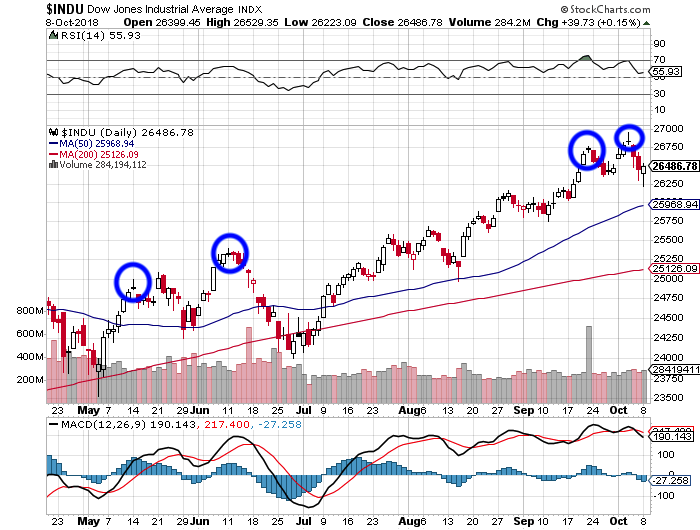
We can see three of them peeking out on this six-month chart of the Dow Jones Industrials. Notice they appeared at top of trend, and proved to be the exact pivoting points.
There’s the Hammer candlestick.
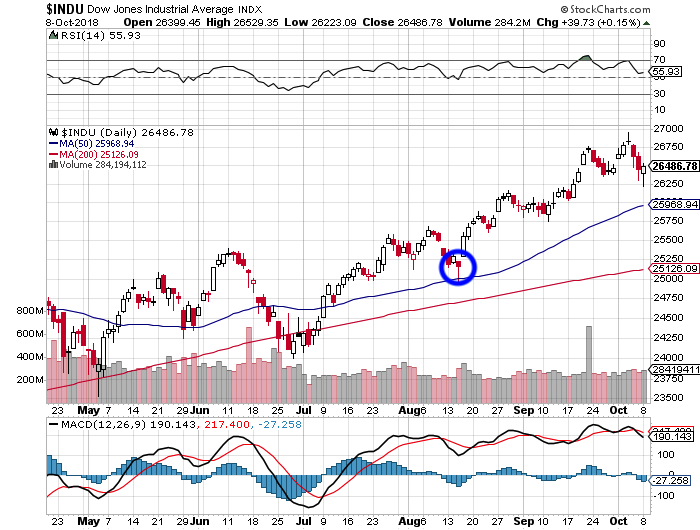
When found at the bottom of a trend, it can be an indication of bear exhaustion.
It’s a sign of a capitulation low created by sellers. It can also be an indicator of potential bullish reversal. Granted, it doesn’t always mean the bulls are now in control. But if often does mean selling activity has just about dried up.
Using the Dow Industrial Average again, we can see a hammer appear at bottom of trend in August 2018. This was a bullish reversal signal at bottom of trend.
Bullish and Bearish Engulfing Patterns
This is by far one of the most powerful patterns to catch on a chart. There are two of them, including the bearish and bullish engulfing patterns.
These happen when a second candle overshadows the previous candle or completely engulfs the previous candle. It means that buyers have overpowered the sellers in the case of a bullish engulfing. And it means that sellers have overpowered the buyers in the case of a bearish engulfing pattern.
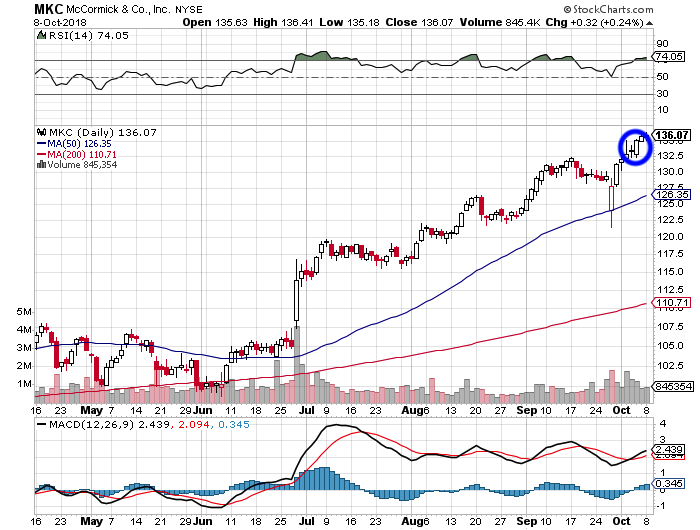
We can see an example of a bullish engulfing pattern in McCormick & Co. (MKC). We can see the doji cross followed by a bullish engulfing candle, for example.
However, when it comes to trading candlesticks, it’s essential that you confirm your findings.
Never buy or sell just because a candle appeared on a chart. Confirm with other indicators such as Bollinger Bands (2,20), MACD, relative strength (RSI), and Williams’ %$R. It always pays to be safe when trading on technical setups.


