Technical Analysis 101: Two of the Most Essential Moving Averages

When it comes to technical analysis, moving averages are essential.
For example, for more than 20 years, I’ve relied on two specifically – the 50-day and the 200-day simply moving average. Not only am I looking for crossovers for golden and death crosses, I want to see if a stock is holding its own above them.
If not, it could be a sign of potential problems and selling pressure.
The 50-day and 200-day are each powerful because they give us a view of a stock’s trend, as well as a look at where we may find support and resistance along the way. For example, if I find a stock that historically bounces every time it hits its 50-day moving average, I’m likely to buy on a test of that moving average.
That’s because, as they say, the trend is your friend.
But if a stock or index pushes below the moving averages, we need to be cautious.
Look at the S&P 500 for example. For the last three years, the index has remained in a tight uptrend, verified by its ability to stay above – or bounce from the two major moving averages.
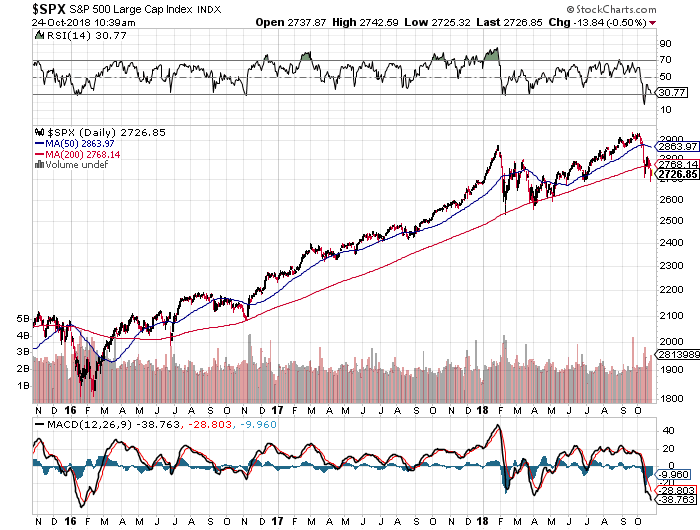
But look at what began to happen in October 2018.
The S&P 500 broke through the 50-day and 200-day moving averages to the downside. That’s something you want to keep an eye on. If the index cannot regroup and recover from just under the moving averages, there exists the potential for a further drop.
For an idea of how bad things can get, take a look at the iShares NASDAQ Biotech ETF (IBB).
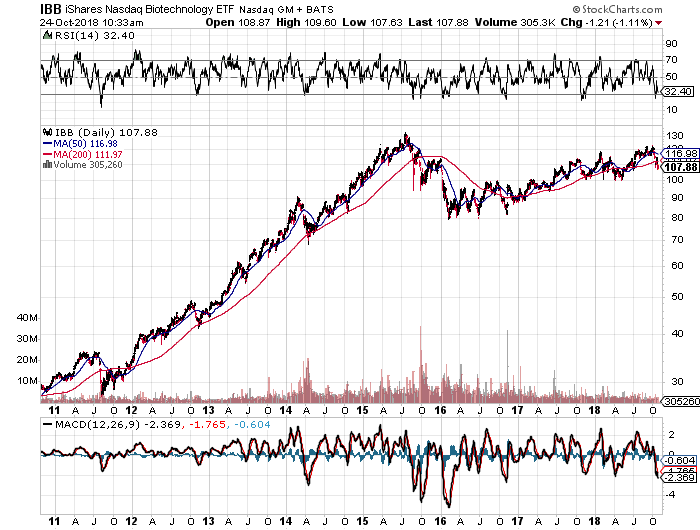
From 2011 to 2015, the IBB held support above its 50- and 200-day moving averages. However, once the ETF broke below both moving averages, the bears took control. The bullish trend that was in place for four years was over, sending the ETF from $130 to $80 in months.
It’s essential that you pay close attention to your moving averages with stocks, ETFs and major indices. They can be a clear indicator of the potential for trend change.
Granted, moving averages aren’t the perfect indications of trend change, but they can give you a general sense of where to spot opportunity on the long and short side.
Of course, it’s also essential that you confirm your findings, as well.
Along with moving averages, include Bollinger Bands (2,20), MACD, relative strength (RSI) and Williams’ %R (W%R) in your technical strategy. It may increase your success rate.


