

Get updates on
new Options articles geared
at improving your trading consistency by providing your email address below!
by registering you agree to our
Privacy Policy
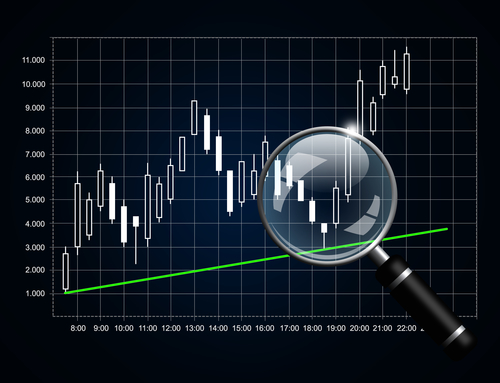
One of the Easiest Ways to Spot Trading Opportunities
Fear can destroy a stock in seconds.
But it can also create a wealth of opportunity if you know when to buy it. In fact, it’s how investors like Warren Buffett, Sir John Templeton, and Baron Rothschild made their money.
Each of them subscribed to fundamental analysis to do so.

Three of the Best Ways to Hedge for Market Downside
Markets are a fickle beast.
Even with the U.S. and China nearing a trade deal, markets began to pull back in March 2019.
While many shifted blame to the President for the move lower, we had to consider that markets were technically stretched. We were overdue for a pullback.
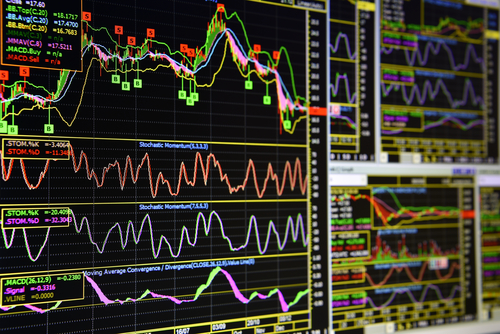
The Five Key Technical Indicators You Need to Use - Always
One of the best ways to spot reversals is by spotting excessive fear.
To do so, we typically watch for agreement among Bollinger Bands (2,20), MACD, Relative Strength (RSI) and Williams’ %R in either overbought or oversold territory. However, we can also strengthen what those indicators say by adding in the Money Flow Index (MFI).

How to Really Let your Winners Run
We’ve all seen fortunes made.
Unfortunately, we’ve also seen fortunes lost in a matter of seconds.

How Using the Money Flow Index (MFI) Can Give You an Edge
When it comes to trading, one of the best ways to tell what’s happening is by paying attention to the flow of money in and out of a stock.
Surely, none of us want to buy a stock if money is flowing out, right?

Using the Chaikin Oscillator to Stay on the Right Side of the Market
Any time you use technical analysis, confirmation is essential.
If you’re not willing to confirm, you’re doing yourself a great disservice. In fact, at no time will I ever just use Bollinger Bands (2,20), MACD, relative strength, or Williams’ R% alone.