

Get updates on
new Options articles geared
at improving your trading consistency by providing your email address below!
by registering you agree to our
Privacy Policy

Gap Trading Fundamentals
All of a sudden, there’s a gap in the chart of your favorite stock.
Surprise news, earnings, something unexpected caused a bout of extreme optimism or pessimism that resulted in the move.
Look at Palo Alto Networks (PANW), for example. In early June 2017, shares closed at $118.59. However, shortly after the close, news of a massive cyber attack began hitting headlines. Orders come flooding in overnight. The next day, the stock opens at $140.

Three of the Greatest Momentum Oscillators
It’s always interesting listening to fundamental and technical analysts argue.
Just as fundamental investors like to laugh at technical analysis, technicians laugh at the absurdity of investing just on fundamentals. It’s a never-ending, laughable fight.
Fundamental analysis shows us what’s under the hood, and whether or not an asset is over- or underpriced, as compared to the competition. In fact, Warren Buffett, Baron Rothschild and Sir John Templeton subscribed to this school of thought and made a fortune. They seeks to uncover the intrinsic or true value of an asset, and is dependent on future sales, earnings, and estimates. It’s pain-staking research at times.
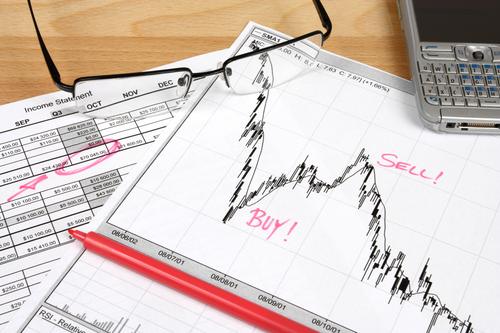
How to Properly Identify Support and Resistance Levels
Make no mistake, technical analysis is just as important as fundamental analysis, and some of the most influential traders in history have made fortunes by proprely applying technical analysis in their trading methodologies.
Let's take a look at how technicians have learned from Jesse Livermore:
“The price pattern reminds you that every movement of importance is but a repetition of similar price movements, that just as soon as you can familiarize yourself with the actions of the past, you will be able to anticipate and act correctly and profitably upon forthcoming movements.”
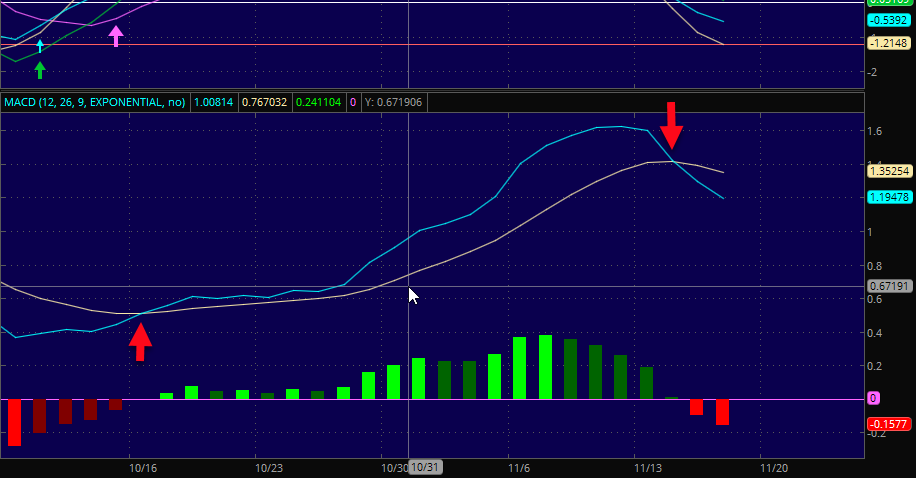
Why the MACD is an Essential Tool
We’re often told that technical analysis is a waste of time.
Traders are often told to ignore it altogether.
“Technical analysis is fundamentally flawed,” says Forbes.
“Technical analysis is stupid,” blared The Motley Fool.
But it’s just not true. In fact, technical analysis is just as important as fundamental analysis.

Technical Analysis: The Importance of Money Flow
When it comes to trading, one of the best ways to tell how strong or weak a stock may be is by paying attention to the Money Flow Index (MFI).
In its simplest terms, money flow is another momentum indicator that indicates strength of money flowing in and out of a stock. If the flow of money into the stock is weak, we’ll begin to see MFI trend down. But as money flows into a stock, we can see this happening when MFI trends up.
It’s also essential in determining overbought and oversold conditions.

Hammers: Two of the Most Powerful Candlestick Patterns
It’s not difficult to understand why candlesticks have become so popular.
Unlike your typical bar or line chart, candlestick charts tell us four essential things in a given day – the open, high, low and close. More importantly, they can tell us how strong or weak the bulls or bears are at a point in time.
For example, if I spot a doji cross at top of trend, it’s an indication of indecision among the bulls and bears. It can also tell technicians – based on historical observations – if a trend is likely to reverse in the opposite direction.