
Get updates on
new Options articles geared
at improving your trading consistency by providing your email address below!
by registering you agree to our
Privacy Policy
A Simple Way to Avoid Head Fakes
Whether you trade currencies, commodities, or stocks, understanding technical analysis is crucial to your success. Unfortunately, many traders continue to fall into the same trap of ignoring the basics like the head fake.
This can happen when a price temporarily moves higher, for example, giving the impression that a bottom may be in place. But as many of us are well aware, trading on the impression of recovery can be costly.
Channel Trading: Three Patterns You Need to Watch
To many, technical analysis is useless.
But as we’ve proven countless times, such analysis is essential, especially when you’re trying to gauge the strength and weakness of momentum with support and resistance.
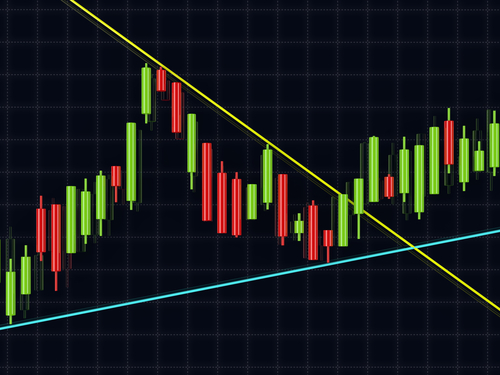
One of the best indicators to understand is the channel, defined as two parallel trend lines within a tight trading range. The upper line connects the price peaks in the channel while the lower line connects the price lows.
Using Multiple Time Frames to Get the Big Picture
One of the best ways to lose money on any trade is to ignore multiple time frames.
For example, if I just rely on a six-month time frame, I miss the bigger picture trend that a one-year, two-year, and even a five-year time frame can offer. Looking at a six-month chart of the iShares NASDAQ Biotech ETF (IBB), it’s tough to gauge anything. It’s full of “noise” and not a lot of direction.
Never Overlook Support and Resistance Levels
Understand how the market moves, and you increase your odds of success.
In theory, markets are pushed higher and lower by fear and greed -- two of the strongest psychological drivers of all assets.
For example, many times you’ll hear technical analysts refer to the ongoing tug of war between bulls and bears, or the struggle between buyers, which represent demand, and sellers, which represent supply. When looking at fear and greed on a chart, we begin to look at the technical parameters of support and resistance, or a price floor or ceiling.
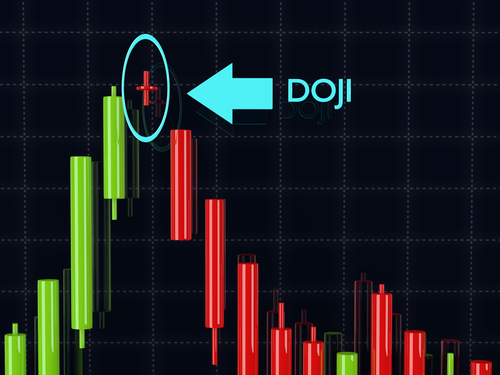
Candlestick Patterns: What a Doji Can Tell You
When Munehia Homma first created candlestick charts in they 1700s, he had no idea it’d change the way we look at stocks 300 years later.
To him, candlestick charting was meant for the rice trade.
How Options Can Help Minimize Risk
Options are still one of the most misunderstood opportunities.
They’re too hard. They’re far too expensive. You have to be rich to trade them. Those are just some of the excuses I’ve heard over the last 20 years. But to be very honest with you those excuses are laughable.

