Channel Trading: Three Patterns You Need to Watch
To many, technical analysis is useless.
But as we’ve proven countless times, such analysis is essential, especially when you’re trying to gauge the strength and weakness of momentum with support and resistance.
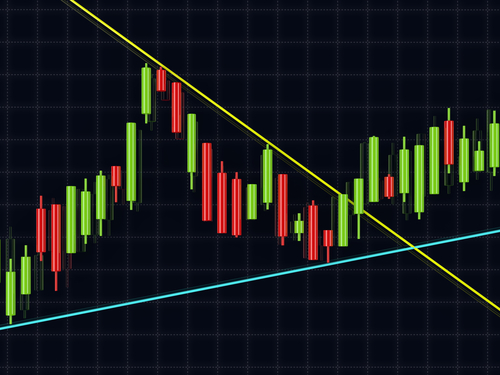
One of the best indicators to understand is the channel, defined as two parallel trend lines within a tight trading range. The upper line connects the price peaks in the channel while the lower line connects the price lows.
What’s nice is that such lines tell you when to buy and when to sell.
If the stock hits the upper line without breaking higher, you sell. When the stock hits the lower line without breaking through, you buy. There is an exception to the rule. Once the price breaks through the top or bottom line, the trend may be beginning to shift. It’s at this point where we want to watch for a new potential channel.
There are then three types of channels to understand.
One is the ascending channel, where the price is contained between upward sloping lines with higher highs and higher lows along the way. For example, you’ll notice an ascending channel with the iShares NASDAQ Biotech ETF (IBB). Since late 2016, the ETF has remained within that tight ascending channel.

The second is the descending channel, where the price is contained between two downward sloping lines with lower highs and lower lows.

The third is the consolidation phase, or the horizontal channel where the stock in question trades sideways in a tight pattern of highs and lows. We can see this in a chart of Advanced Micro Devices (AMD), where bulls looked for a potential break higher.

And then, of course, if the trend is broken to the upside or downside (which we can also see in the above Best Buy chart), we have a potential breakout. The idea is that once a stock begins to break above prior resistance points, the stock has the potential to trend even higher and that once thousands of traders learn about it, they pour in. But the key to trading a breakout successfully is by being early.
Think of its like this. When you’re stopped at a stoplight, you don’t try to predict when the light will go green. Instead, you just hit the gas and hightail it out of there when it does. The same approach happens with a stock. Once it breaks above prior resistance points, watch and wait for potential movements.
Of course, with any indicator, confirmation is key.
Never buy just because of what the channel may be telling you. Be sure to confirm with other indicators, such as your Bollinger Bands, MACD, relative strength, money flow, and even Williams’ %R. The last thing you want to do is get caught up in a false break.
Another way to confirm if the break is real or not is with a change in volume. Consulting volume for confirmation of breakout is essential to ensure changes in supply and demand. If the stock begins to break higher, yet there’s not a lot of volume, we have to question the validity of the move. Without it, we don’t know if the stock has simply gotten ahead of itself or if it’s actually breaking out at all. To spot a potential breakout candidate, find stocks that have a strong line of support and resistance.
Wait for the break to happen without trading the initial break higher.
Remember, informed traders are the best traders.


