Candlestick Patterns: What a Doji Can Tell You
When Munehia Homma first created candlestick charts in they 1700s, he had no idea it’d change the way we look at stocks 300 years later.
To him, candlestick charting was meant for the rice trade.
He’d record the opening day’s price of rice, the low and the close. And over time, he’d begin to see price patterns in his recordings, mapping out repetitive signals in the price bars. He’d soon give them names, like spinning tops, dojis, and hanging man – candlestick names we still use to this day. The discovery of such patterns helped him successfully predict future direction of rice prices, giving him a significant advantage over other traders.
He was so successful stories say he made the equivalent of $10 billion in today’s dollars.
Granted, many traders believe candlesticks are nothing but hogwash. To others, it helps identify the potential for price changes, especially after a big run higher, or a big run lower.
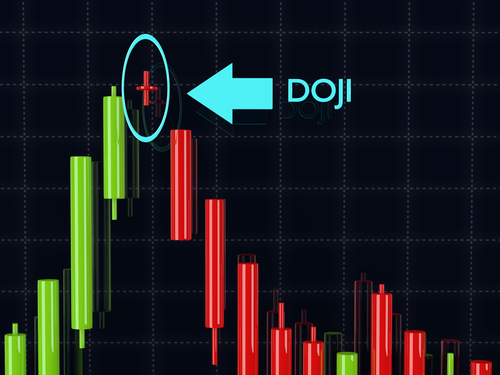
For example, doji crosses are a sign of indecision of bulls and bears. When found at the top or bottom of trend, it can indicate that a reversal in the other direction may be nearing. However, as with any technical indicator, confirmation is key.
Typically, when we see a doji at top or bottom of trend, it can be a sign of indecision among the bulls and bears. They tell us there’s a potential reversal in the stock.
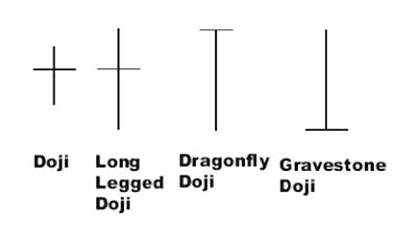
But when it comes to the gravestone version of it, it’s just as deadly as it sounds.
These look like an actual gravestone from the side. Each is formed when the open, low and close of the day are all the same. What it can tell us – especially if found at top of trend – is that bulls are becoming exhausted and are beginning to sell. In a way, it’s burying any hopes for making any more money on the upside of a trade.
If we turn the gravestone upside down, we now have a dragonfly doji, which can also signal indecision at top or bottom of trend, and indicate potential shift in direction. With this candle, the open, high and close are the same.
Keep in mind that just because a cross appears at top of trend doesn't mean you should run out and short the stock in question. That’s just ridiculous. Instead, confirm the finding by also looking at the position of the stock with regards to Bollinger Bands, moving averages, MACD, relative strength, money flow and Williams’ %R for example.
Take a look at this six-month chart of Shopify Inc. (SHOP) for example.
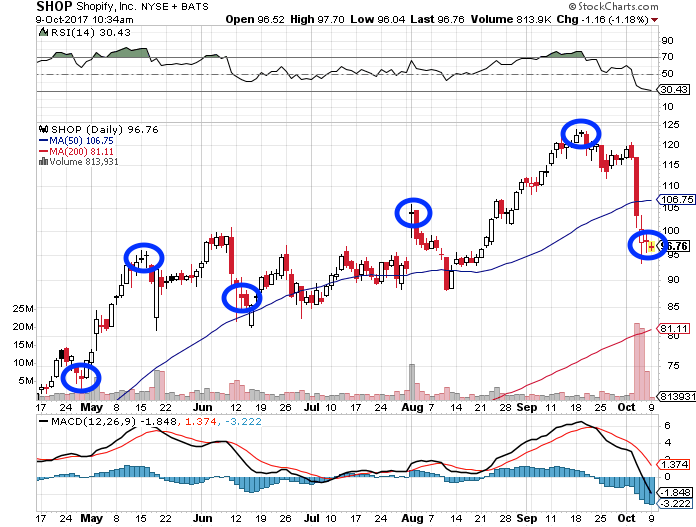
Notice what happens when a long-legged cross or a simple doji cross appears. It begins to indicate indecision among bulls and bears. As you can see here they were powerful indications of trend reversal. Ridiculous sounding or not, they’re worth watching.


