

Get updates on
new Options articles geared
at improving your trading consistency by providing your email address below!
by registering you agree to our
Privacy Policy

How the Relative Strength Indicator Can Give You an Edge
Traders are often told to buy excessive fear or greed.
Unfortunately, many of those traders aren’t aware of when to pull the trigger, or realize when fear or greed have gotten way out of control. Then, when they finally do decide to make the trade, the stock has already begun to pivot.
And more often than not, they miss the profit opportunity.
While none of us have a crystal ball, or hold the Holy Grail to trading secrets, you can give yourself an edge by simply paying attention to what herd mentality is telling you.

The Best Time to Enter a Trade
“Opportunity is missed by most people because it is dressed in overalls and looks like work.”
Those very words of Thomas Edison still hold true today.
But rest assured, that’s a mistake – a potentially costly one that’s cost investors millions, especially when they overlook game-changing opportunities.

Using Bollinger Bands and Keltner Channels in Your Trading
Most of us are familiar with what happens when you pull a rubber band too far.
It has a tendency to snap back. That same idea applies to stocks, too. For example, if a stock sells off too much too fast, it has a tendency to snap back, or revert to mean.
Or, if a stock runs too high, too fast, it’ll often snap back as well.
How to Spot Potential Breakout Opportunities
Great traders will always go where the action is.
Volatility, momentum, new highs, and liquidity are some of the key traits they’ll look for. Other times, there’s a fundamental reason for the break, including news, or event that’ll draw even more traders in.
Just what is a breakout, though?

The Magic of Moving Average Crossovers
By now, you’re well aware of how to find trends using simple moving averages, such as the 50- and 200-day moving averages. But you should also know how to potentially spot when a trend could stop dead in its tracks, or birth a new trend.
All we have to do is wait for a crossover to do so.
For example, we can spot a bullish “golden cross” when the short-term moving average, such as the 50-day crosses above the longer-term average, such as the 200-day. When this happens, we’ll typically see a move higher in a stock or an index.
Look at the Dow Jones Industrials for example.
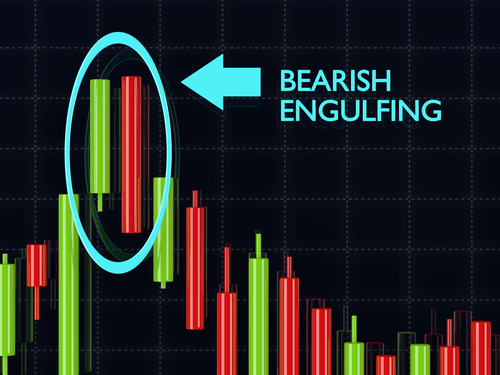
It Pays to Watch for Engulfing Candlesticks
o the average trader, candlestick patterns are a bunch of crosses and oblong shapes with odd names, like the three black crows, or the abandoned baby bottom.
Some traders choose to ignore them. Others understand that it gives a clear illustration of the war between the bulls and the bears. In fact, every time you look at a candle you can see who is ahead, who is falling behind, and whether or not the war has come to a standstill of indecision.
For example, a doji cross is the perfect picture of indecision.