It Pays to Watch for Engulfing Candlesticks
To the average trader, candlestick patterns are a bunch of crosses and oblong shapes with odd names, like the three black crows, or the abandoned baby bottom.
Some traders choose to ignore them. Others understand that it gives a clear illustration of the war between the bulls and the bears. In fact, every time you look at a candle you can see who is ahead, who is falling behind, and whether or not the war has come to a standstill of indecision.
For example, a doji cross is the perfect picture of indecision.

That cross tells us neither side won the war that day. It also tells us things could turn if found, especially at bottom or top of trend.
Or, look at the engulfing candlestick pattern, of which there are two types.
Let’s begin with the bullish engulfing pattern.
This one forms when a large white candlestick appears next to a smaller red or black candlestick, engulfing it. What that suggests is that the bulls have now taken control of the stock price from the bears. The pattern will follow a stock price decline, and indicate potential reversal off a low.
Take a look at Snap Inc. (SNAP), fore example.
Notice the three bullish engulfing patterns that began to form at bottom of trend. The third appearance marked the bottom, as did an over-extension on MACD and RSI.

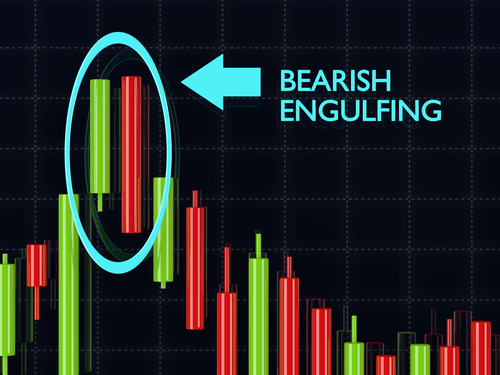
The bearish engulfing pattern is the exact opposite.
This one forms when a large red or black candlestick appears next to a smaller white candlestick, engulfing it. What that suggests is that the bears have now taken control of the stock price from the bears. The pattern will show up after a price runs higher, potentially indicating reversal.

However, just because an engulfing pattern appears, be sure to confirm.
Keep in mind that just because the candle appears at top of trend doesn't mean you should run out and short the stock in question. Instead, confirm the finding by also looking at the position of the stock with regards to Bollinger Bands, moving averages, MACD, relative strength, money flow and Williams’ %R for example.
Also, wait to see a close higher or lower prior to buying what appears to be a change in trend. The last thing you want to get caught up in is a false signal. Remember, to make money in this market, we have to trade well with confirmation.
Or, you’re really just speculating, throwing money at the wall, hoping something sticks.
Remember, you have a technical advantage if you know who’s winning the war.


