Why the MACD is an Essential Tool
We’re often told that technical analysis is a waste of time.
Traders are often told to ignore it altogether.
“Technical analysis is fundamentally flawed,” says Forbes.
“Technical analysis is stupid,” blared The Motley Fool.
But it’s just not true. In fact, technical analysis is just as important as fundamental analysis.
As technicians have learned from Jesse Livermore, for example, “The price pattern reminds you that every movement of importance is but a repetition of similar price movements, that just as soon as you can familiarize yourself with the actions of the past, you will be able to anticipate and act correctly and profitably upon forthcoming movements.”
We could easily go on. However, we you’ll agree that technical analysis is essential.
Granted, there’s no such thing as the Holy Grail to technical analysis. But it’s still difficult to argue against the use of technical analysis when it works so well.
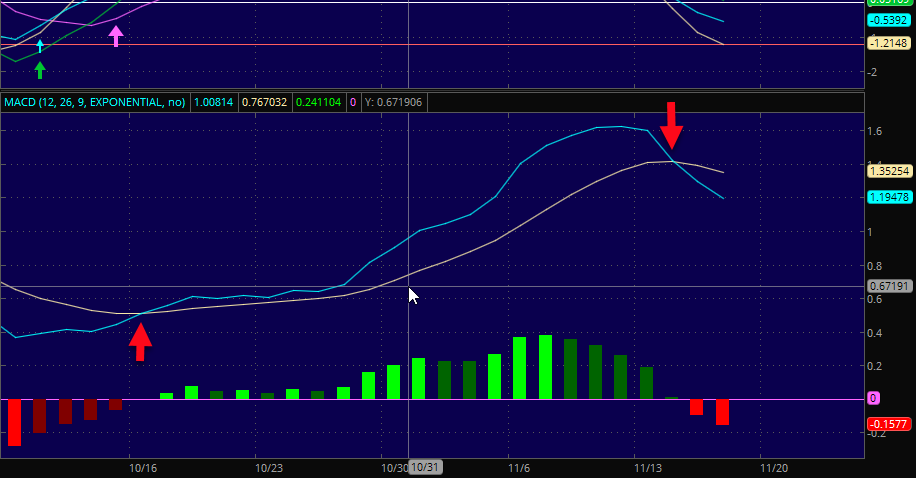
Of the many indicators we’ve discussed, one of the most essential ones is MACD, or moving average convergence divergence, which can help determine short-term momentum.
According to Stock Charts:
The MACD turns two trend-following indicators, moving averages into a momentum oscillator by subtracting the longer moving average from the shorter moving average. As a result, the MACD offers the best of both worlds: trend following and momentum. The MACD fluctuates above and below the zero line as the moving averages converge, cross and diverge. Traders can look for signal line crossovers, centerline crossovers and divergences to generate signals.
It can also help identify oversold and overbought conditions when confirmed with other indicators, such as Bollinger Bands, relative strength (RSI), money flow (MFI), Williams’ %R (W%R) and even candlestick formations.
Look at Spark Therapeutics (ONCE) for example.
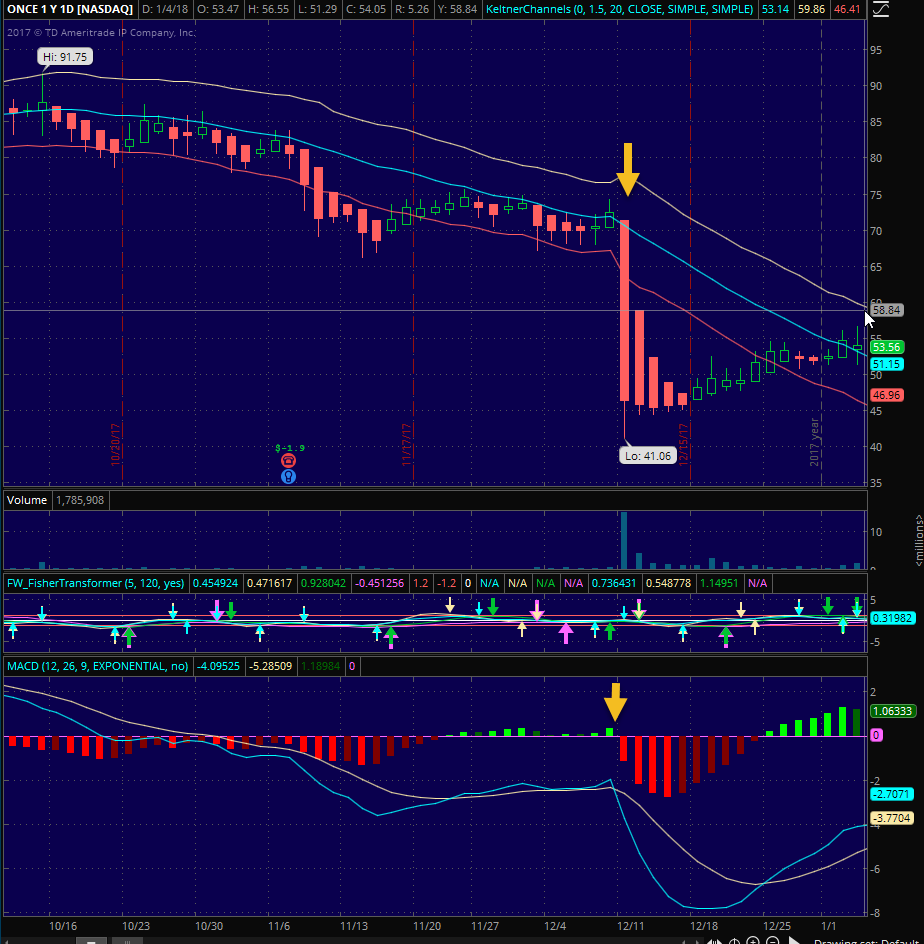
In December 2017, shares of Spark Therapeutics (ONCE) fell 40% on disappointing drug data. However, at the time, it appeared the Street was overlooking other opportunities this company had to offer. For one, the company had just secured a unanimous recommendation from a key FDA advisory committee for Luxturna, a gene therapy that can restore functional vision in a small subset of patients.
Technically, look at what happened after the gap lower.
One, RSI was excessively oversold under its 30-line. Two, Williams’ %R was under its 80-line. And MACD had dipped well into oversold territory as well.
Shortly after each indicator confirmed the other, shares of ONCE began to bounce.
The last time MACD was this low was in January 2016. Shortly after that, the stock, as confirmed with other indicators, bounced from a low of $22.50 to $36.
In fact, pull up any of your favorite charts and look at what happens with MACD spikes or dives, confirmed with other indicators. About 80% of the time, it’ll pivot.
To succeed often, look for an instance of extreme moves in MACD momentum. And whatever you do, never use it as a standalone indicator. Always confirm with other information prior to trading currencies, stocks, or even indices.
Trade smart. Trade safe. And be fully aware of all setups before a trade.


