The Five Key Technical Indicators You Need to Use - Always
One of the best ways to spot reversals is by spotting excessive fear.
To do so, we typically watch for agreement among Bollinger Bands (2,20), MACD, Relative Strength (RSI) and Williams’ %R in either overbought or oversold territory. However, we can also strengthen what those indicators say by adding in the Money Flow Index (MFI).
The Money Flow Index
MFI helps us spot strength of money flowing in or out of a stock, an ETF, and an index. It can also be used to confirm trends and potential pivot points.
For example, if MFI is below 20, the stock can be considered oversold.
If MFI is above 80, the stock can be considered overbought.
Of course, we’d never just rely on MFI to buy or sell a stock. We would use other confirming technical indicators, such as the ones mentioned above. But let’s take a quick look at just why we want to include MFI in our technical analysis.
Let’s use the Dow Jones Industrial Average (DJIA), as an example.
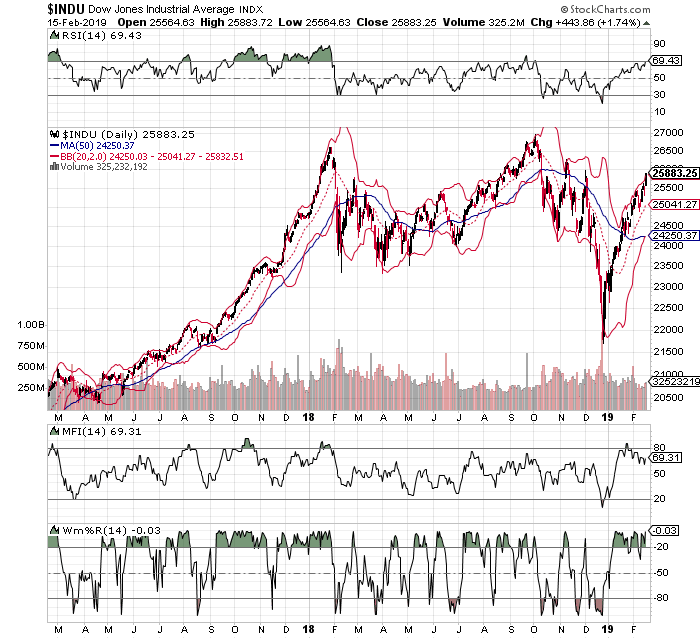
Let’s also focus on extreme bouts of fear on the DJIA for this example.
Since the start of 2018, notice what happens to the index when the lower Bollinger Bad (red line) is hit or penetrated at the lows. Not long after we typically see a pivot from that lower Band.
We can confirm that things have gotten way out of hand by using RSI.
Notice what happens when the lower Band is hit, and RSI has pulled back to or below its 30-line. Not long after, the stock pivots higher. However, we can confirm our findings yet again by looking at Williams’ %R. Now, notice what happens when the lower Band is hit, RSI is at its 3.0-line, and Williams’ is at or below its 80-line. Yep, the index bounces again.
Another one of my favorite indicators to use for confirmation is MFI.
Over the last year, each time it falls to a low of about 30, that is its extreme low. That’s the pivot point for MFI with DJIA. As you can see in late December 2018, it fell to an extreme low of less than 20, which confirmed our findings at the lower Band, on RSI, and on Williams’ %R.
The beauty of these indicators – it helps us spot exactly when the herd has gotten far too fearful.
After using these very indicators over the last 20 years, they’ve been accurate 80% of the time.


