One of the Easiest Ways to Spot Trading Opportunities
Fear can destroy a stock in seconds.
But it can also create a wealth of opportunity if you know when to buy it. In fact, it’s how investors like Warren Buffett, Sir John Templeton, and Baron Rothschild made their money.
Each of them subscribed to fundamental analysis to do so.
However, we can take it a step further by adding in technical analysis. After all, technical analysis has a history of successfully highlighting bouts of excessive fear and greed.
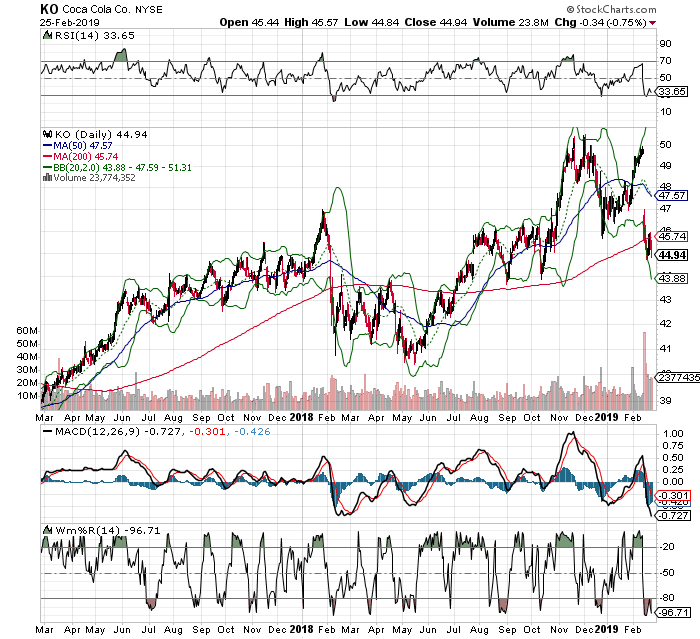
Look at Coca-Cola (KO), for example.
While the company issued fourth quarter numbers that were in line with expectations, cautious guidance for fiscal 2019 was a signal of slowing economic trends.
CEO James Quincey said the company tempered expectations after noting a slowdown late 2018. “We think we have a great plan, we’ve got good momentum, but we’re being realistic and cautious on the global outlook,” as noted by The Wall Street Journal.
That was enough to send the stock screaming lower from $50 to $44.77 in days.
On the gap lower, many argued that a good amount of fear was priced in, as the impact of the bearish news was priced into the stock. While others were ignoring the stock in late February 2019, some traders began to buy based on a technical alignment among four indicators.
In this two-year chart of KO, notice what happens about 80% of the time when the stock touches or penetrates its lower Bollinger Band (2,20). Not long after, the stock bounces.
Of course, we never want to rely on a single indicator to buy.
So, we can confirm with relative strength (RSI). Notice what has historically happened when the lower Band is hit, and RSI hits or penetrates its lower 30-line. The stock bounces.
We can also confirm with over-extensions on MACD.
After a big move lower in the stock, if MACD dips as much as it has on this chart, it’s historically proven itself to be unsustainable. Not long after, the stock bounces.
We can also confirm with Williams’ %R (W%R). Each time this indicator dips to or below its 80-line, and confirms the other oversold indicators, the stock bounces.
You can clearly see on the chart how well this technical alignment has worked.
It’s just another way to spot where excessive fear has gotten out of hand. Spot it in time, and you could be rewarded with a wealth of opportunity.


