Three of the Most Powerful Technical Pivot Indicators

When bungee jumpers plummet off a bridge, what happens?
They pop back up, right?
The very same thing happens with stocks when they become too overbought or oversold. And if we can position ourselves for the exact moment the “snap back” happens, we can make money. And it’s actually quite easy to spot.
All we need are three indicators that specifically tell us the bungee cord has been pulled too far.
These include the following technical indicators:
Bollinger Bands (2,20)
Named after John Bollinger, the Bands are typically placed two standard deviations above and below a moving average. For example, a trader may choose to use an intermediate-term moving average of 20 with two standard deviations above and below that average.
The idea behind such bands is simple.
When a stock – or index – touches or penetrates the lower band, the situation can be considered oversold. When a stock touches or penetrates the upper band, it can be considered overbought.
This is step one for letting us know a stock is overbought or oversold.
But we never want to rely on one indicator, so we confirm with others, such as RSI and W%R.
Relative Strength (RSI)
We can use RSI to confirm other indicators above. When RSI moves to or above the 80-line, we have an overbought condition. When RSI moves to or below the 20-line, we have an oversold condition. It confirmed what Williams was telling us.
Williams % Range (W%R)
When Williams moves to or above its -80, it’s an indication the asset is oversold. When it moves to or above the -20-line, it’s overbought.
For this to work, all three indicators must align in either overbought or oversold territory. Then you buy on oversold conditions, or short on overbought conditions and wait. Look at the Dow Jones for example. Notice what happens each time the lower Bollinger Band is hit or penetrated with RSI at its 30-line, and with W%R at its 80 line.
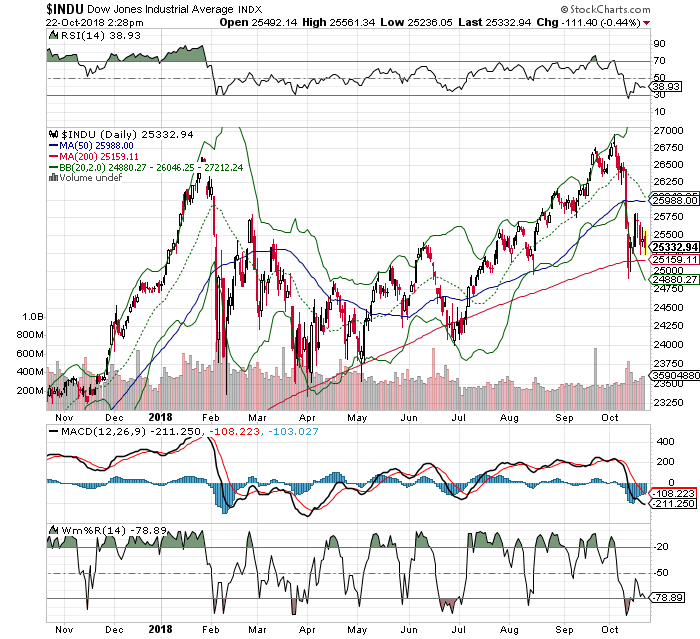
About 80% of the time, the index pivots in the other direction. Try it with your favorite stocks using a one, two, and three-year time frame. Let us know if you spot similar patterns using the indicators noted above.


