Why it Pays to Use these 4 Key Technical Tools

Sometimes, simplicity is the best way to spot opportunity.
In early August 2018, shares of Weight Watchers (WTW) plunged $12 unexpectedly on an earnings overreaction. But the news really wasn’t worthy of such a gap lower.
The company posted a 28% year over year jump in subscribers for the second quarter, bringing its subscriber base to 4.5 million. However, despite that news, it lost 100,000 subscribers quarter over quarter. That’s why the stock fell.
Simply because it lost 100,000 subscribers quarter over quarter, WTW deserved to lose $12.
Right? In my opinion, it was an overreaction.
Revenue for the quarter was up 20% year over year to $410 million. EPS jumped to $1.01 from 67 cents a year earlier. It even raised its full year guidance to between $3.10 and $3.25 per share from $3 to $3.20. Better still, this is actually the company’s second revision to guidance. Initially, it was only expecting a profit range of between $2.40 and $2.70.
Even analysts at B. Riley FBR reiterated their buy rating while raising the price target from $103 to $113 a share. Perhaps they, too, considered it an overreaction.
The question then becomes – when do we buy WTW?
We simply wait for the bad news to be priced in, and for selling pressure to begin to fade.
Easier said than done, right?
If you pay attention to the technical pivot points provided by Bollinger Bands (2,20), relative strength (RSI), MACD and Williams’ %R (W%R), they’ll tell you exactly when to buy.
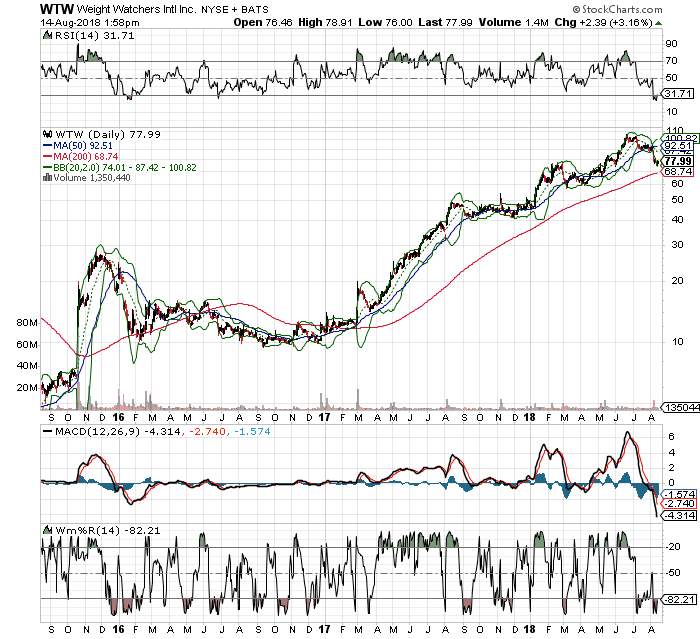
In August 2018, the stock fell to its lower Bollinger Band, oversold. RSI was below its 30-line, oversold. MACD fell to a historic low. And Williams’ %R fell under its 80-line, oversold. The last time it was this severely oversold and each indicator fell into oversold territory, WTW pivoted from a low of $58 to $105.
In fact, each time over the last three years that a similar technical setup appeared, the stock pivoted and moved higher. In fact, in January 2016, WTW plummeted from about $30 to $10. However, once each of these pivot points aligned in oversold territory, the stock bounced.
While it doesn’t work 100% of the time, it’s a great starting point to finding opportunities.
Go ahead, pull up your favorite charts and see for yourself how well it can dictate momentum.


