Trade Entry: Look for Confirmation with These Indicators

If done properly, technical analysis can work up to 80% of the time. Granted, there is no Holy Grail, but if we use the right indicators, we increase our odds of success. Especially if we apply those indicators to well known stocks that may only be down temporarily.
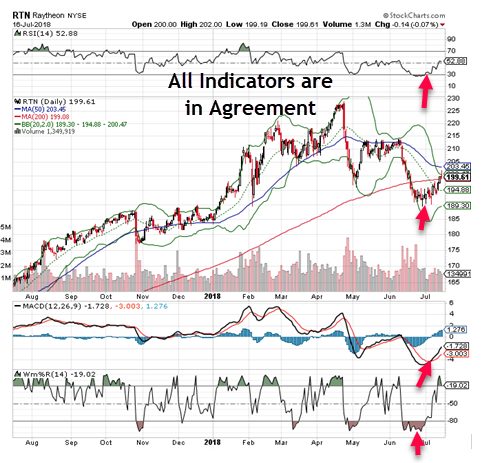
Let’s look at Raytheon (RTN) for example.
In late June 2018, the stock plummeted from $215 to $189 in days on trade war fears. However, we knew the stock was far too oversold at its lower Bollinger Band because RSI was oversold at its 30-line. MACD had pulled back too far too fast. And Williams’ %R was below its 80-line.
Once all of those indicators aligned, the stock began to pivot. Then, in about four days, the stock moved from $189 to $205. When I show traders this trick, the immediate reaction is always, “Any one can show me what happened after the fact.”
But here’s the thing. It takes days for the move to work out, handing us opportunity.
The same thing happened in May 2018. The stock hit its lower Band. RSI was at its 30-line. MACD was down too much, too fast. Williams’ %R was below its 30-line. The same thing happened in November 2017 as well.
But why stop there?
Now look at what happened in February 2018 and April 2018. The stock had just run up in both occasions. But take a look at what happened at the upper Band. RSI was now above its 70-line. MACD pushed up too far, too fast.
Williams’ %R was now above its 20-line. And down came the stock.
Again, there is no Holy Grail to trading. It doesn’t exist. If it did, I’d own my own island already. But if used correctly, this combination of technical indicators can help you achieve the goals you may be after.


